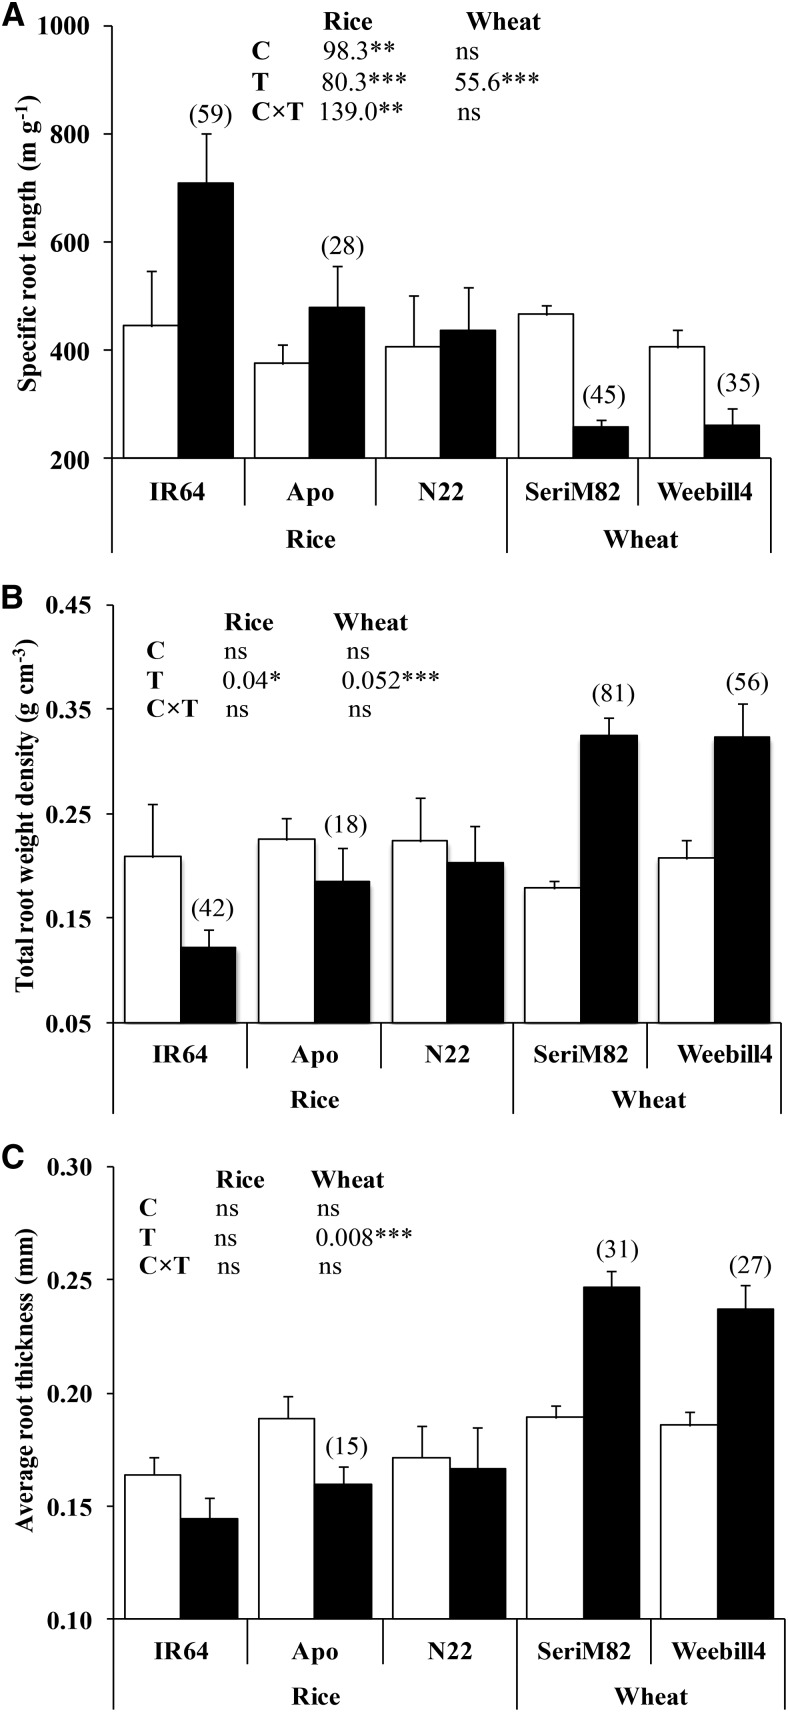
Figure 2.
Specific root length (A), total root weight density (B), and average root thickness (C) of rice and wheat (mean ± se). White columns represent control, and black columns represent water deficit stress. Values in parentheses represent the significant percentage change (increase or decrease) over the control. The ANOVA results with lsd values are given for cultivar (C), treatment (T), and cultivar-treatment interaction (C×T). Significance levels are as follows: *P < 0.05, **P < 0.01, and ***P < 0.001.

