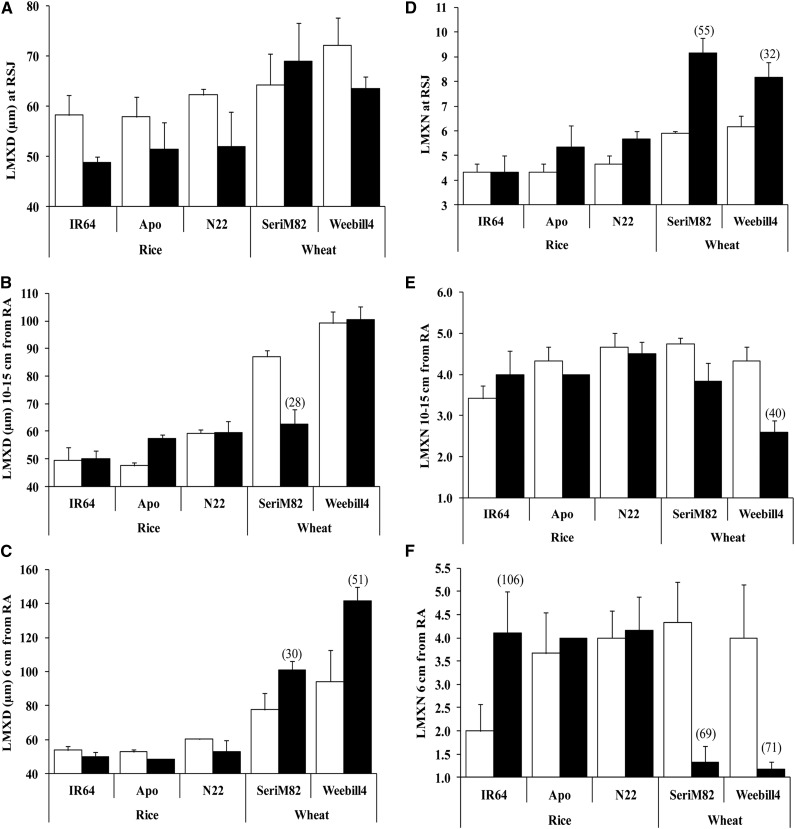
Figure 7.
LMXD and LMXN at the RSJ (A and D), 10 to 15 cm from the RA (B and E), and 6 cm from the RA (C and F) on nodal roots of rice and wheat (mean ± se). White columns represent control, and black columns represent water deficit stress. Values in parentheses represent the significant percentage change (increase or decrease) over the control value.

