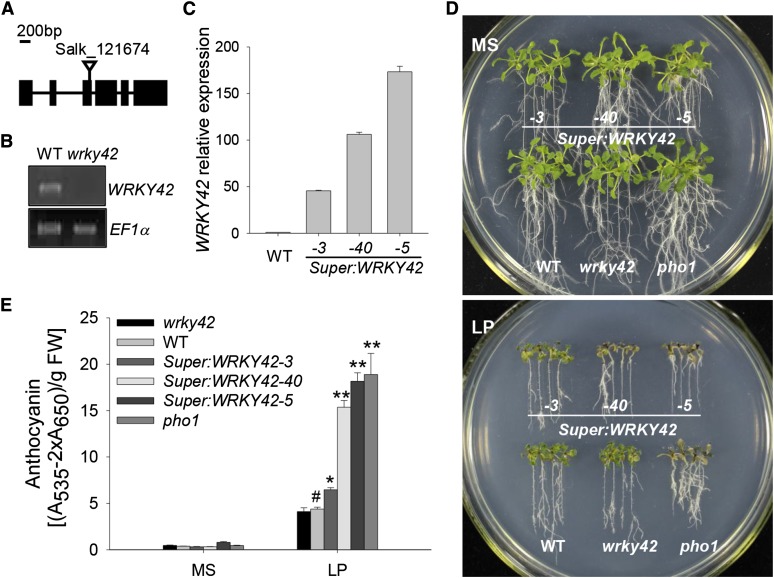
Figure 3.
Phenotype tests of various plant materials. A, Diagram of the WRKY42 gene showing the position of the T-DNA insertion. Exons (boxes), introns (lines), and the T-DNA insertion site of Salk_121674 (triangle) are indicated. B, RT-PCR analysis of WRKY42 expression in the wrky42 mutant (Salk_121674) and wild-type (WT) seedlings. The EF1α is amplified as the control. C, qRT-PCR analysis of WRKY42 expression in the WRKY42-overexpressing lines (Super:WRKY42-3, Super:WRKY42-40, and Super:WRKY42-5) and wild-type plants. Transcript level of WRKY42 was quantified relative to ACTIN2/8. The data represent the mean values of three replicates ± se. D, Phenotype comparison of the wrky42 mutant, WRKY42-overexpressing lines, the pho1 mutant, and wild-type seedlings during Pi starvation. Seven-day-old seedlings were transferred to MS medium (Pi-sufficient medium with 1.25 mm Pi; top) or LP medium (low-Pi medium with 10 μm Pi; bottom) for another 10 d; then, photos were taken. E, Anthocyanin accumulation in the wrky42 mutant, WRKY42-overexpressing lines, the pho1 mutant, and wild-type seedlings during Pi starvation. Seven-day-old seedlings were transferred to MS or LP medium for another 10 d; then, the seedlings were harvested for anthocyanin content measurement. Data are shown as means ± se (n = 3). Asterisks indicate significant differences compared with wild-type plants (paired test). FW, Fresh weight; *, P < 0.05; **, P < 0.01; #, wild-type plants were used as a control.

