Figure 9.
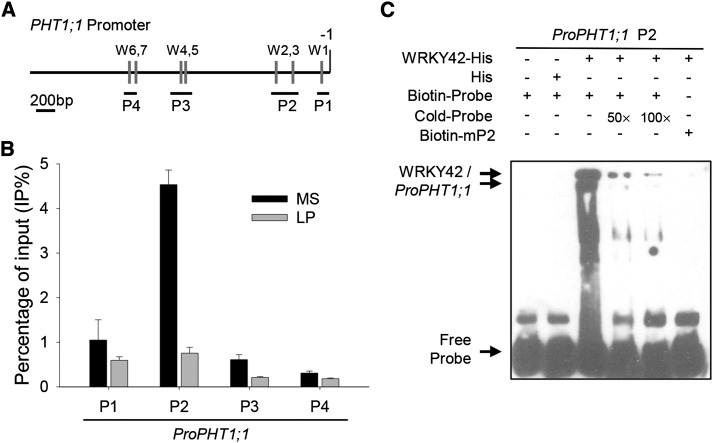
WRKY42 binds to the PHT1;1 promoter. A, Diagram of the PHT1;1 promoter region showing the relative positions of the W-boxes (gray rectangles) and the relative positions and sizes of the different PCR-amplified fragments (black lines under the W-boxes). The adenine residue of the translational start codon ATG was assigned position +1, and the numbers flanking the sequences of the PHT1;1 promoter fragments were counted based on this number. B, ChIP-qPCR assay to detect the association between WRKY42 and the PHT1;1 promoter. Seven-day-old seedlings were transferred to Pi-sufficient (MS) or Pi-deficient (LP) condition for another 7 d; then, the roots were harvested for ChIP-qPCR assay with anti-WRKY42. The ratio of immunoprecipitation DNA to the input was presented as the percentage of input (IP%). The data are presented as means ± se (n = 3). C, EMSA to analyze the binding of WRKY42 to P2 fragment of the PHT1;1 promoter. Each biotin-labeled DNA probe was incubated with His-WRKY42 protein. An excess of unlabeled probe was added to compete with labeled promoter sequence. Biotin-labeled probe incubated with His protein served as the negative control.

