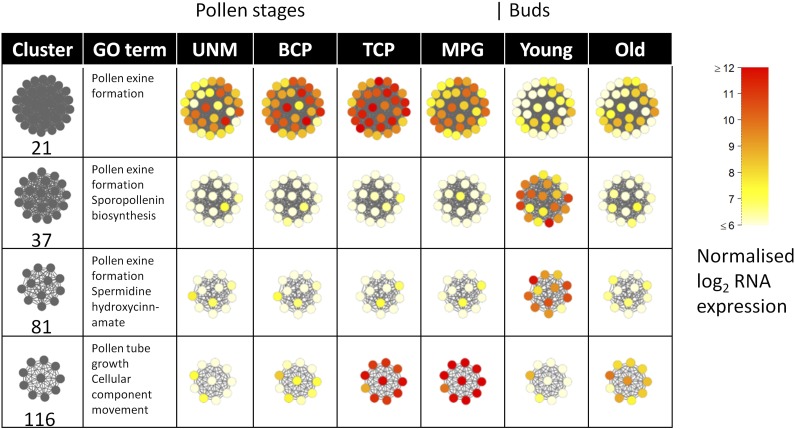
Figure 6.
Gene expression levels in the four selected clusters, showing the data (Honys and Twell, 2004; Yang et al., 2007a) used to generate FlowerNet. UNM, Unicellular microspores; BCP, bicellular pollen; TCP, tricellular pollen; MPG, mature pollen grain. Young buds represent pollen mother cell mitosis I, while old buds represent mitosis II.

