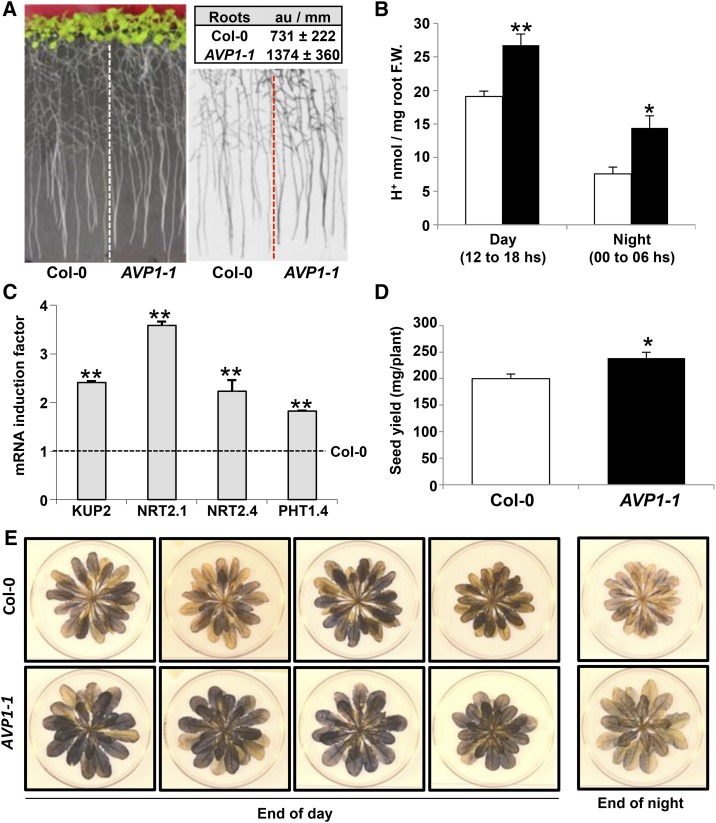
Figure 3.
Indirect evidence of enhanced photoassimilate transport from source-to-sink tissues in AVP1-1 plants. A, 14CO2 labeling of plants grown in culture. Left, Plants before labeling. Right, Autoradiogram after 15 min of labeling and 60-m chase in normal air. Inset, 14C in roots quantified as arbitrary units per millimeter (n > 10 roots measured; P value for t test < 1 × 10⁻⁵; one representative plate of four trials). B, Protons released from the roots during day and night hours by Col-0 (white bars) and AVP1-1 (black bars) plants grown in liquid medium (means ± se; n = 6 pools of 10 plants per line per time of day per trial; two independent trials). C, Expression of sugar-induced ion transporter genes (as indicated) in roots of AVP1-1. Data normalized to expression in Col-0 plants. Data are the average of three independent measurements ± se; n = 3 plants per line per trial; five independent trials. D, Seed production in Col-0 and AVP1-1 plants grown for 70 d in soil under a 12-h/12-h day-night cycle (means ± se; n = 7 per line per trial; two independent trials). E, Lugol’s staining of representative 50-d-old plants grown under a 12-h/12-h day-night regimen (n = 8 per line per trial; two independent trials). Significant differences relative to the wild type (Col-0) are based on Student’s t test. F.W., Fresh weight; *, P ≤ 0.05; **, P ≤ 0.01.

