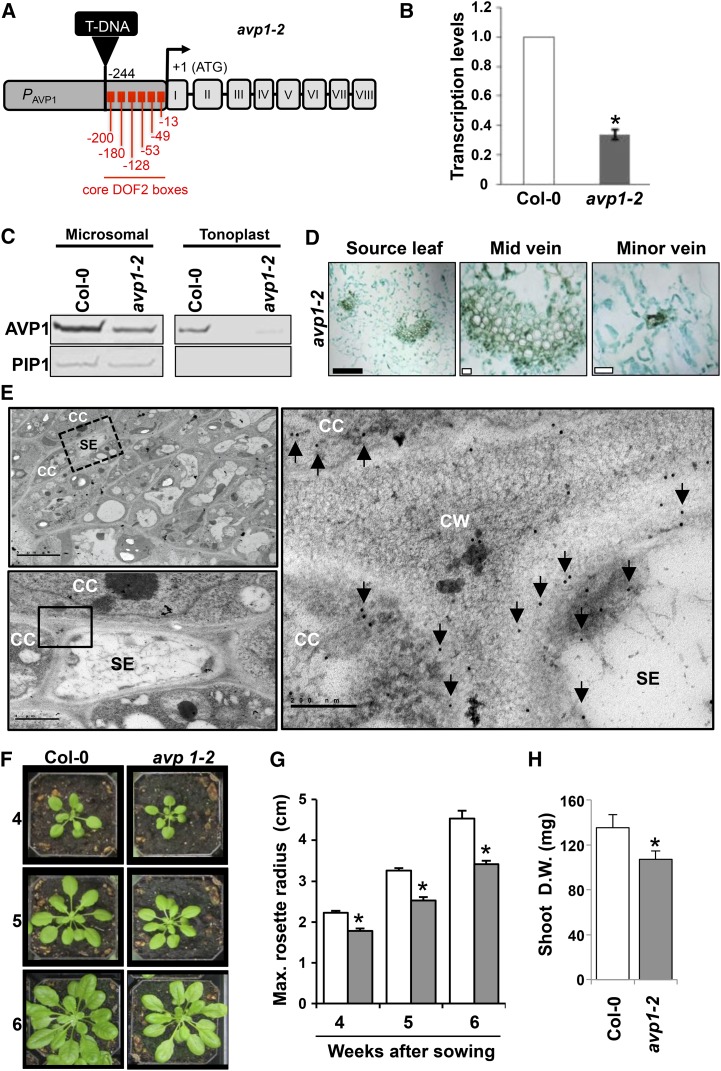
Figure 6.
Molecular characterization and growth parameters of avp1-2 (SALK 046492). A, Genomic structure of the AVP1 gene showing the T-DNA insertion of the avp1-2 line at −244 bp relative to the ATG start codon. Red squares indicate DOF2 elements. B, AVP1 gene expression analysis in Col-0 and avp1-2 plants was determined by qRT-PCR (means ± se; n = 4 plants per line; the relative mRNA levels were normalized to the UBQ10 gene). C, Immunoblots of AVP1 and PIP1 from total microsomal and tonoplast fractions extracted from Col-0 and avp1-2 plants. D, Immunohistochemical analysis of AVP1 expression in transversal sections of avp1-2 adult source leaves. Black bars = 0.1 mm; white bars = 0.01 mm. E, Ultrastructural details of avp1-2 minor vein. Upper left, Transverse sections treated with anti-AHA3 sera and gold-conjugated secondary antibody. Lower left and right, Higher magnification of dotted and solid boxed regions, respectively. Arrows show gold particles localized at the PM of companion cells and sieve elements. F and G, Phenology and growth of Col-0 (white bars) and avp1-2 (gray bars) plants at different times after sowing as indicated. Maximum rosette radius: means ± se; n = 20 plants per line (pot width = 5.8 cm). H, Shoot dry weight of 50-d-old plants (means ± se; n = 6 plants per line; two independent trials). Significant differences relative to Col-0 are based on Student’s t test. CC, Companion cell; CW, cell wall; D.W., dry weight; SE, sieve element; *, P ≤ 0.05.

