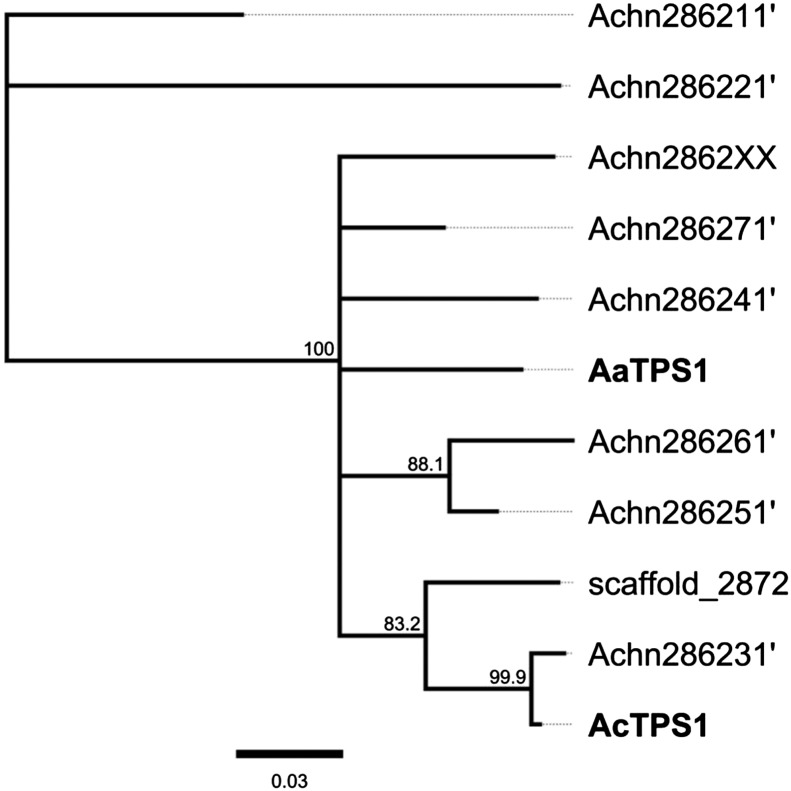
Figure 3.
Phylogenetic analysis of the AaTPS1 and AcTPS1 homologs in A. chinensis ‘HongYang.’ Protein sequences extracted from the kiwifruit genome were aligned using ClustalW and manually curated (Supplemental Fig. S2, A and B).The evolutionary history was inferred using the neighbor-joining method with the Jukes-Cantor genetic distance model. The consensus tree is shown based on 80% support threshold. The percentage of trees in which the associated taxa clustered together is shown next to the branches based on 1,000 bootstrap replicates. The tree is drawn to scale, with branch lengths measured in the number of substitutions per site. The analysis involved 11 amino acid sequences and no outgroups. Evolutionary analyses were conducted in Geneious 6.1.6.

