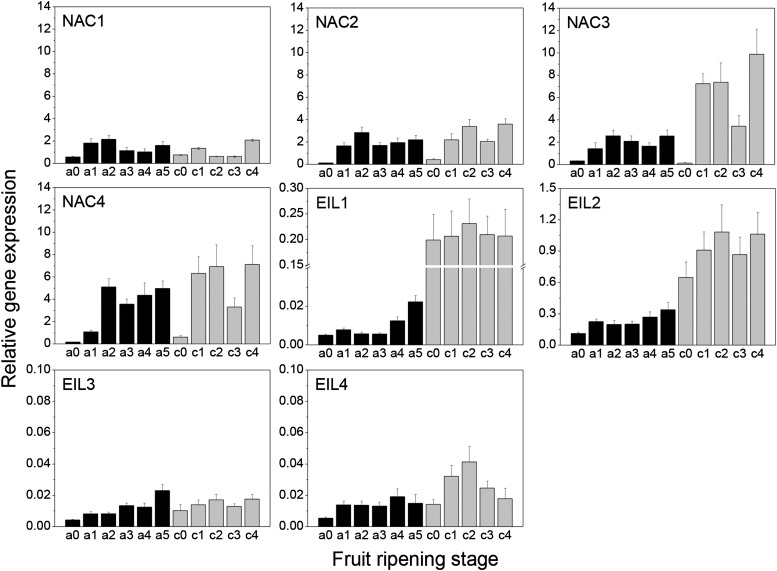
Figure 8.
Expression of NAC and EIL TFs during fruit ripening in A. arguta (black bars, ripening stages a0–a5; see text) and A. chinensis (gray bars, ripening stages c0–c4; see text). Real-time qPCR analyses were performed on pooled fruit samples using gene-specific primers given in Supplemental Table S2. Error bars are based on four technical replicates, and data were normalized against the housekeeping gene EF1α. Error bars represent ±se.

