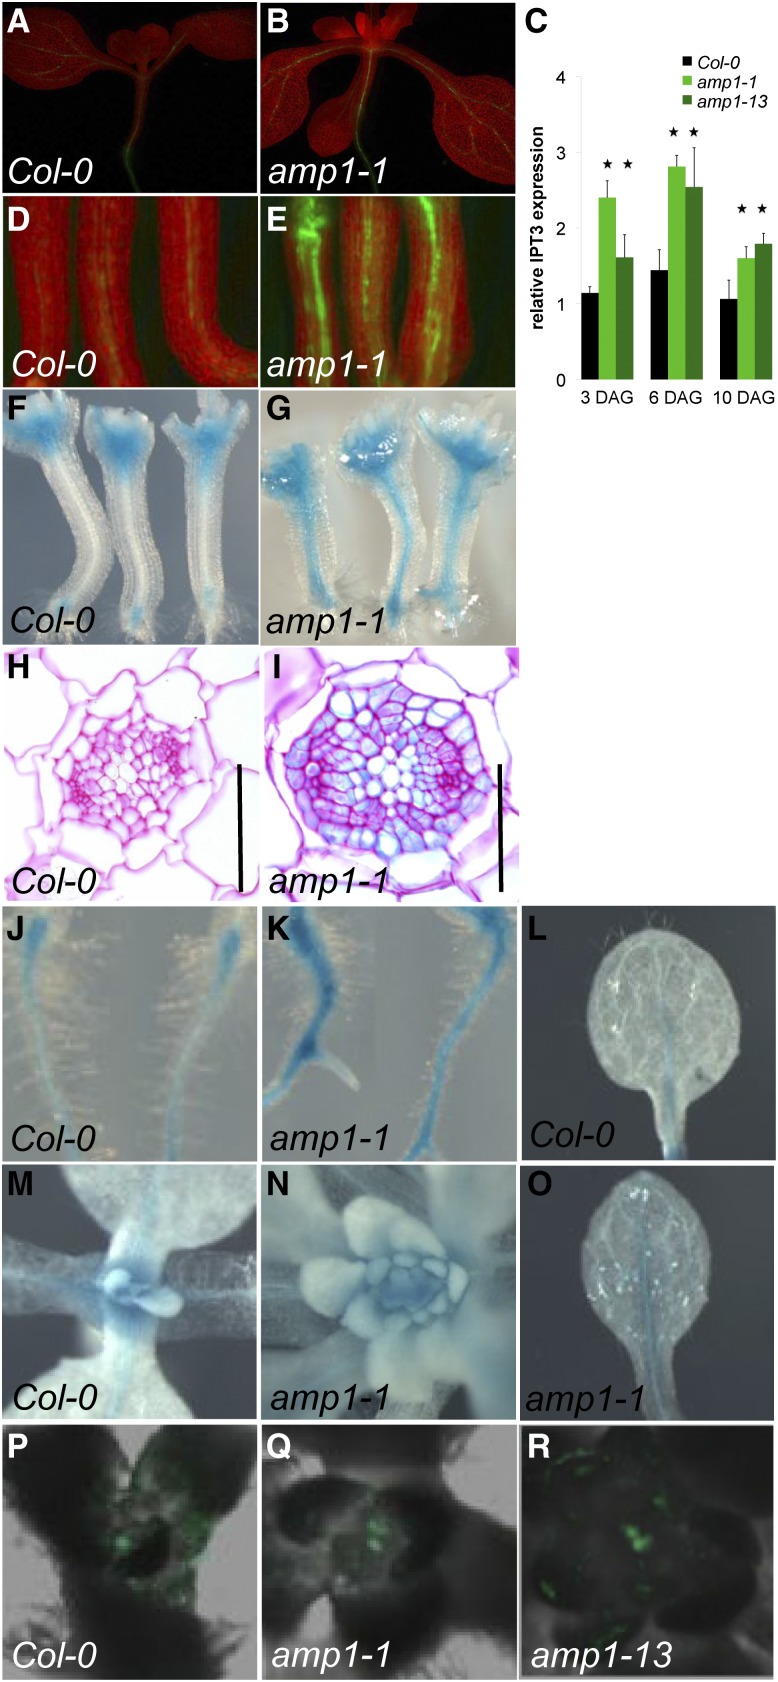
Figure 2.
Tissue-specific expression analysis of IPT3 and CK response markers in amp1. A, B, D, and E, IPT3::GFP reporter analysis in 7-d-old wild-type (A and D) and amp1-1 (B and E) seedlings. D and E show hypocotyl region of three individual plants. C, Expression analysis of IPT3 in the wild type and amp1 by qRT-PCR. Relative transcript levels (mean ± sd) were calculated from triplicate qRT-PCR reactions of independent RNA samples prepared from three different sets of seedlings for each developmental stage. Relative expression is normalized to glyceraldehyde 3-phosphate dehydrogenase C2 (GAPC2). Asterisks indicate statistical significance (P < 0.05, n = 3). F to O, ARR5::GUS analysis in 7-d-old seedlings. Hypocotyls of the wild type (F) and amp1-1 (G). Transversal section of the vascular cylinder from the central hypocotyl of the wild type (H) and amp1-1 (I). J, Top root of the wild type. K, amp1-1. SAM area of the wild type (M) and amp1-1 (N). L, True leaf of the wild type. O, True leaf of amp1-1. P to R, TCS::GFP analysis in SAMs of 7-d-old seedlings. P, The wild type with one central TCS::GFP domain. amp1-1 (Q) and amp1-13 (R) show two distinct TCS::GFP foci in one SAM. Bars = 50 μm.

