Figure 8.
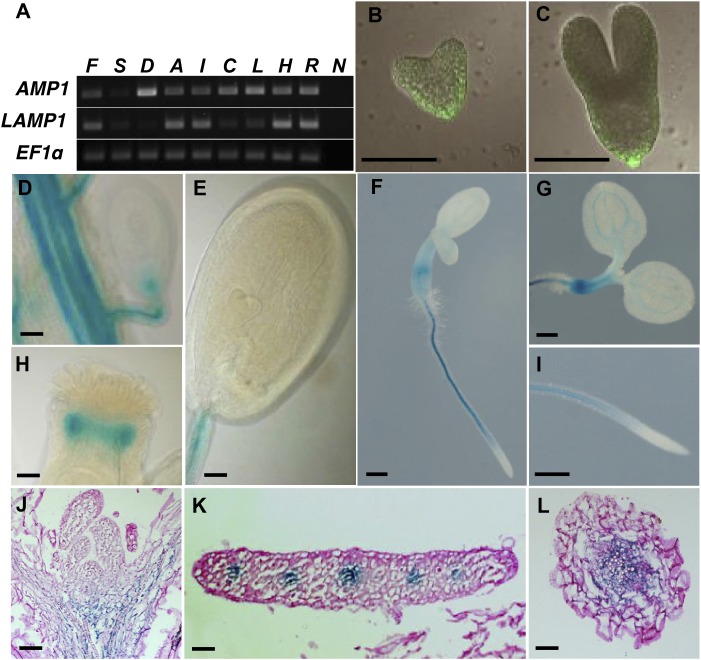
Tissue-specific expression patterns of AMP1 and LAMP1. A, Semiquantitative reverse transcription-PCR analysis comparing expression levels of AMP1 and LAMP1 in different tissues. ELONGATION FACTOR 1α (EF1α) was used as normalization control. B and C, AMP1::AMP1-GFP localization in heart stage embryo (B) and torpedo stage embryo (C). D to I, Whole-mount analysis of pLAMP1::GUS activity in the vascular tissue of the placenta and the funiculus and in the micropylar pole of the ovule (D), developing seed with heart stage embryo (E), 3-d-old seedling (F, G, and I), and style (H). J to L, pLAMP1::GUS localization in median longitudinal section of the shoot apex (J) and transversal sections of true leaf (K) and hypocotyl (L). F, Flowers; S, siliques; D, dry seeds; A, axillary buds; I, inflorescence stems; C, cauline leaves; L, rosette leaves; H, hypocotyl; R, roots; N, no cDNA added. Bars = 50 μm (B–E, H, and J–L) and 300 μm (F, G, and I).

