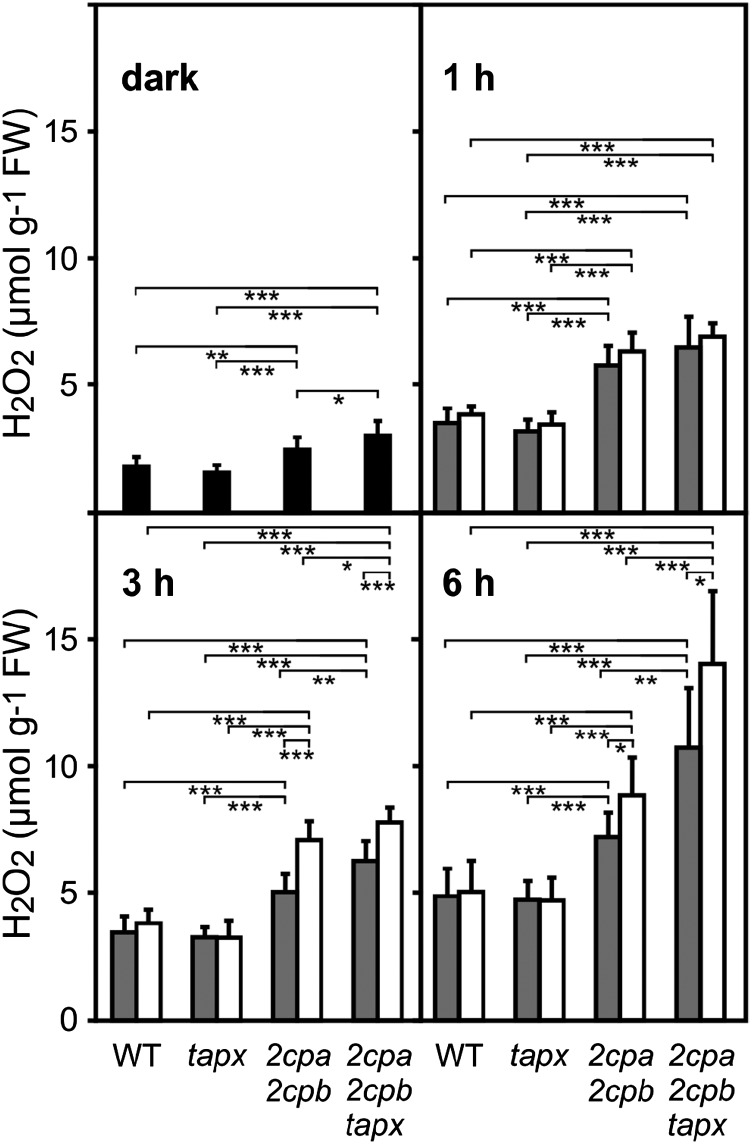
Figure 5.
Light-induced H2O2 levels in different genotypes. At the end of the night, leaves of wild-type (WT), tapx, 2cpa 2cpb, and 2cpa 2cpb tapx plants were kept in the dark (black bars) for 3 h or treated with ML (gray bars; 160 µmol m−2 s−1) or HL (white bars; 900 µmol m−2 s−1) for the times indicated. Whole-leaf H2O2 levels were determined using the homovanillic acid fluorescence assay. All values shown are means ± sd (n = 10). Significant differences between mean values are indicated by asterisks using Student’s t test. FW, Fresh weight; *, P < 0.05; **, P < 0.01; ***, P < 0.001.

