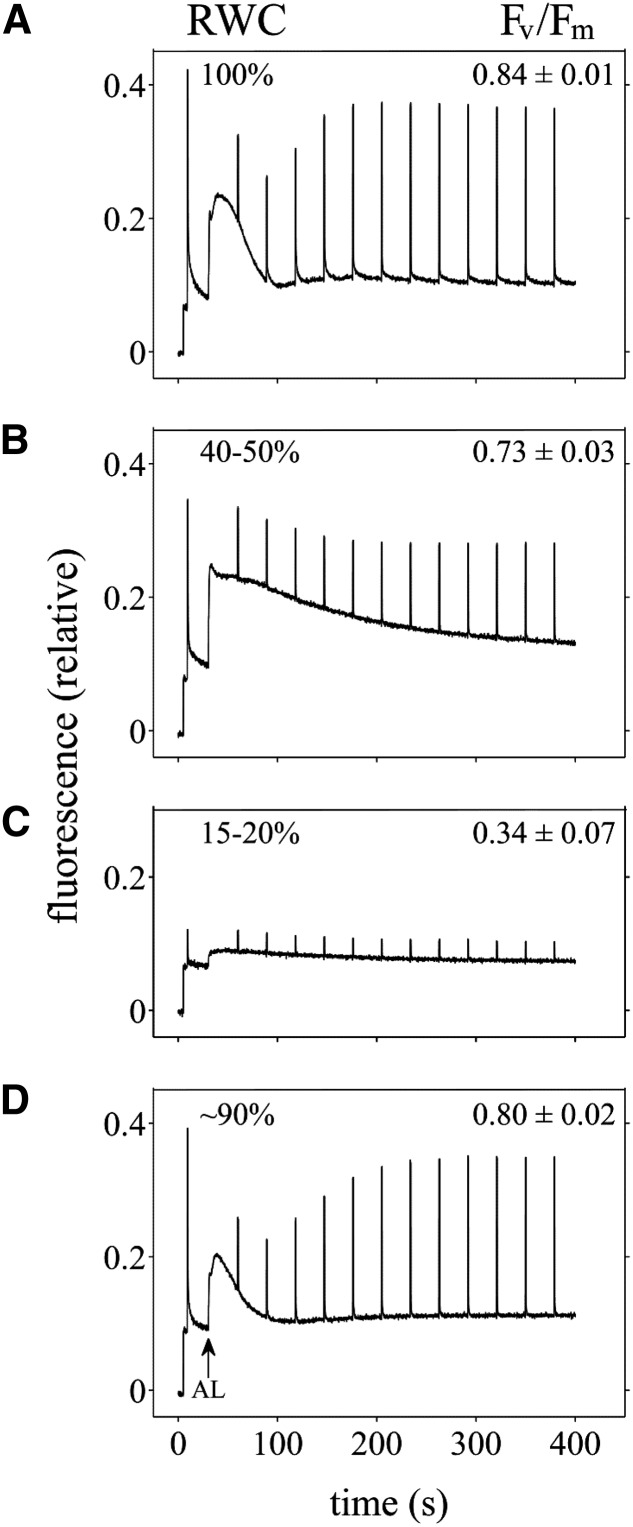
Figure 2.
Modulated chlorophyll fluorescence of plants at different hydration states. Representative traces recorded on leaves from plants at RWC of 100% (A), 40% to 50% (B), and 15% to 20% (C) during dehydration, and of approximately 90% (D) following rehydration for 18 h, are shown. A saturating flash was applied to dark-adapted leaves to determine Fv/Fm (denoted on graphs ± sd; n = 3), and afterward a red actinic light (AL; 635 nm, 100 µmol photons m−2 s−1) was turned on. Saturating flashes were also applied during the light treatment to determine Fm′.

