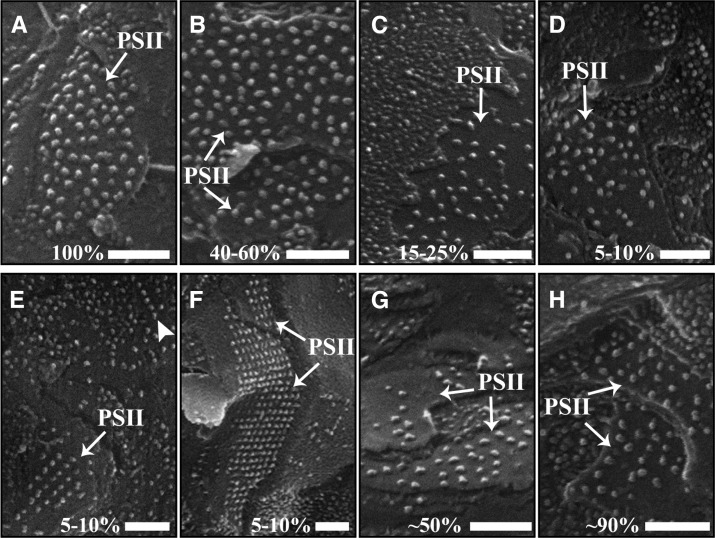
Figure 4.
Changes in the density and arrangement of PSII complexes in grana thylakoid membranes during dehydration and rehydration. PSII complexes in the exoplasmic fracture face of stacked membranes (EFs) are shown in plants at different RWC during dehydration (A–F) and following 4 and 24 h of rehydration (G and H, respectively). RWC (%) is denoted at the bottom of each panel. During dehydration, the density of PSII decreases, as is clearly evident at 15% to 25% RWC (C). Remarkably, in drier plants, PSII complexes arrange into rows (E, arrowhead) and two-dimensional arrays (E and F). During rehydration, the density of PSII increases gradually (G and H). For analysis of the density of PSII at the different hydration states, see Figure 5. Bars = 100 nm.

