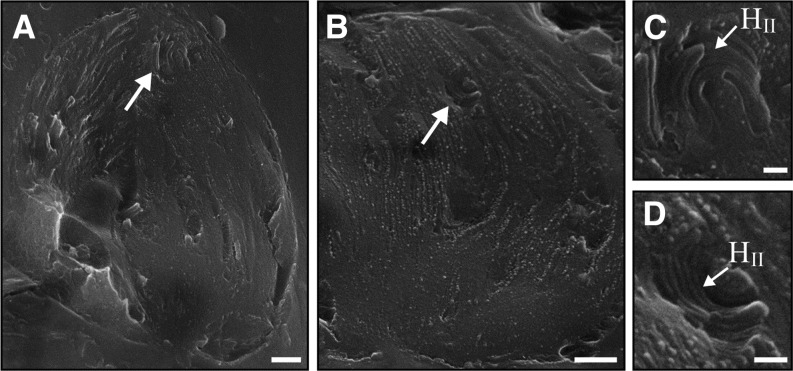
Figure 6.
Presence of HII lipid phases in chloroplasts of dehydrated plants. A and B, Low-magnification cryo-SEM images of chloroplasts in plants dehydrated to 5% to 10% RWC. C and D, Higher magnification images of the areas marked by the white arrows in A and B, showing the typical onion-like structure of HII phases. Note the lack of protein complexes within these segregated lipid phases. Bars = 200 nm (A and B) and 50 nm (C and D).

