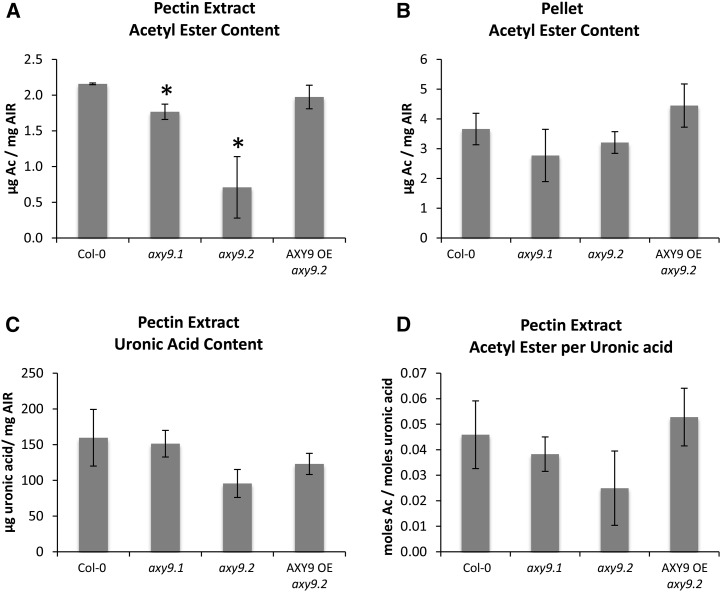
Figure 5.
A and B, Total acetic ester content of a pectin extract (A) and the remaining pellet (B) of etiolated seedling material. C and D, The uronic acid content was measured for the pectin extract (C), and the molar ratio of acetic acid to uronic acid was calculated (D). Ac, Acetate; OE, overexpression. Error bars indicate sd (n = 3). Asterisks indicate statistically significant differences from Col-0 (Student’s t test, P < 0.05).

