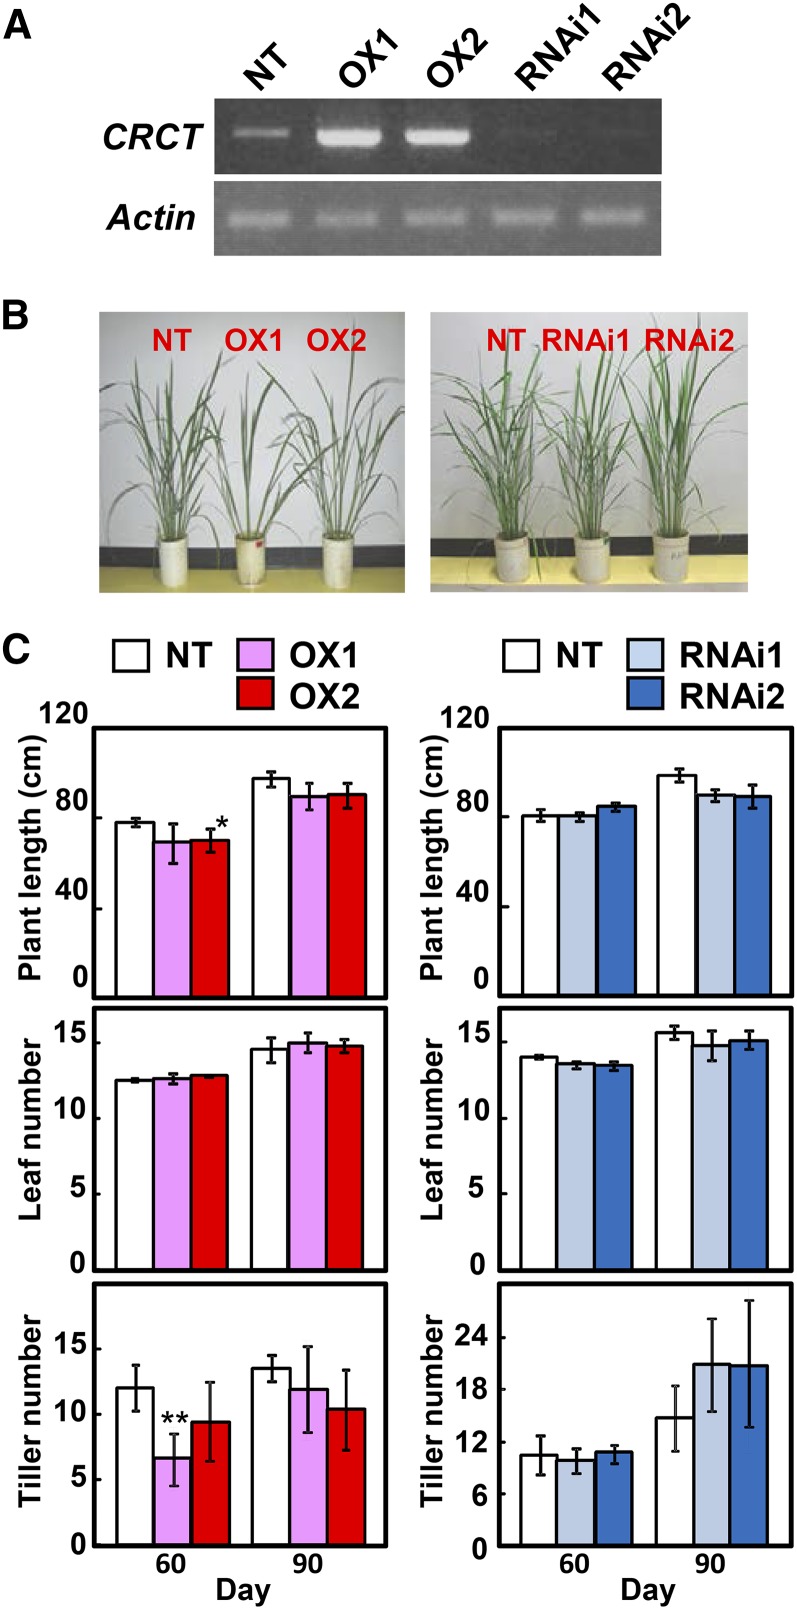
Figure 3.
Effects of overexpression or knockdown of CRCT on growth. A, Expression analysis of CRCT in leaf sheath by PCR. Actin was used as internal control. B, Transgenic rice plants at 60 d after sowing. C, Plant growth of CRCT transgenic lines. Plant length, leaf number, and tiller number were determined at 60 and 90 d after sowing. Plants were grown in temperature-controlled greenhouse under natural sunlight. Asterisks indicate significant difference between NT and transgenic rice by Student’s t test (P < 0.01). OX1 and OX2 indicate CRCT overexpression lines, and RNAi1 and RNAi2 indicate CRCT knockdown lines.

