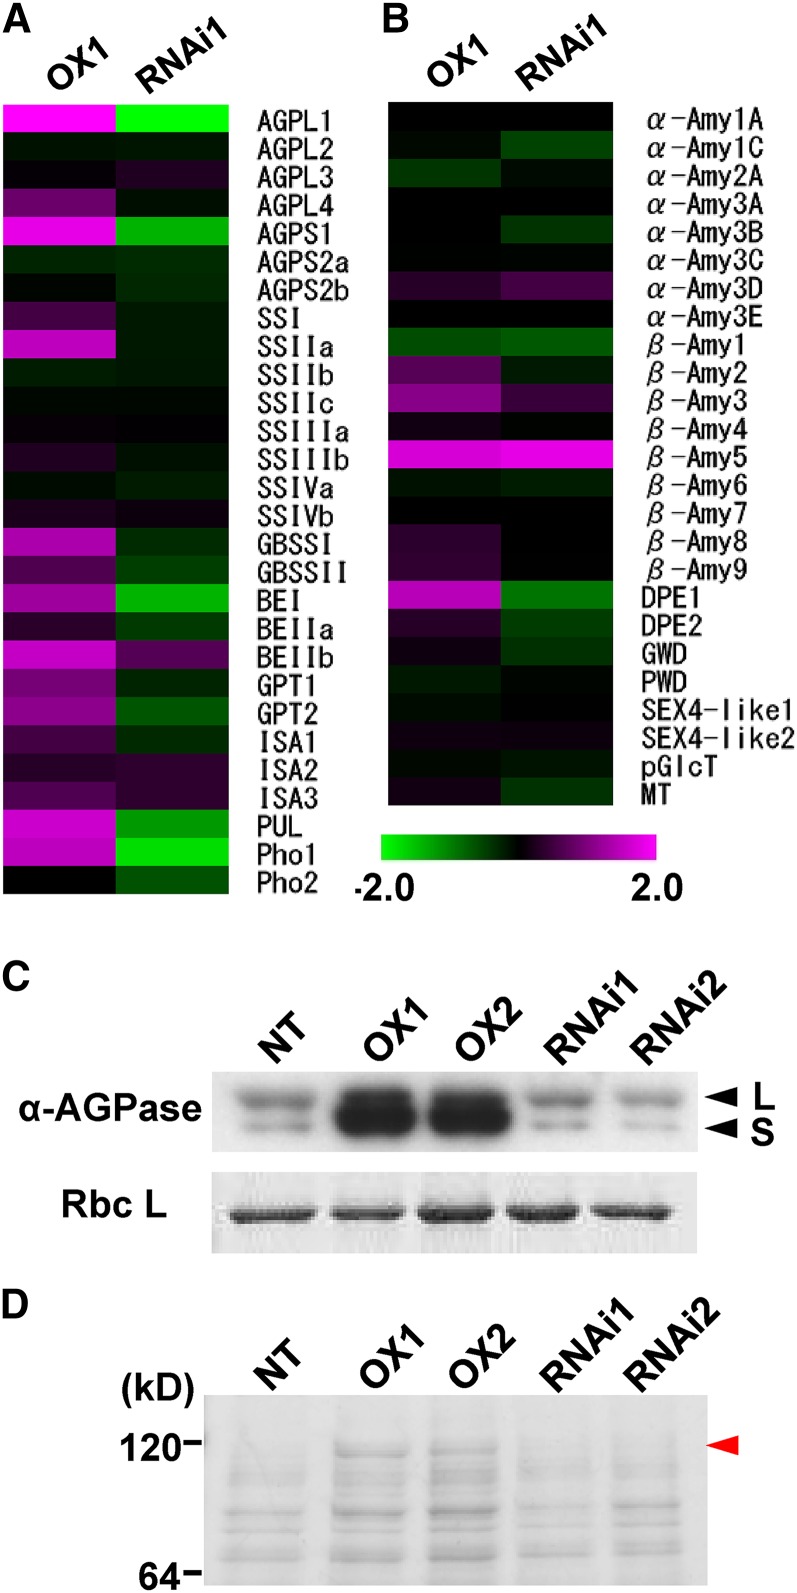
Figure 9.
Expression analysis of genes related to starch synthesis and starch degradation in leaf sheath. A, Microarray analysis of genes related to starch synthesis. B, Microarray analysis of genes related to starch degradation. Purple indicates higher, while green represents lower, expression by overexpression (left) and knockdown (right) of CRCT. The scale shows log2 at –2.0 to 2.0. Values are expressed as the mean of four replicates. Heat map view was created using TIGR MeV 4.0 software (Saeed et al., 2003). Data and P values are listed in Supplemental Tables S5 and S6. ISA, Isoamylase (DBE); PUL (DBE); α-Amy, α-amylase; β-Amy, β-amylase; DPE, disproportionating enzyme; GWD, α-glucan water dikinase; PWD, phosphoglucan water dikinase; starch excess4-like (SEX4-like), starch phosphatase-like protein; pGlcT, plastidial Glc translocator; MT, maltose translocator. C, Expression levels of AGPase. Total soluble proteins from leaf sheath were separated by SDS-PAGE. AGPL (L) and AGPS (S) were detected by immunoblotting using an antiserum raised against Arabidopsis AGPase. Rubisco large subunit (RbcL) was detected by Coomassie Blue staining and used as internal control. D, Protein profile of leaf sheath analyzed by SDS-PAGE. Total soluble proteins of leaf sheath were separated by SDS-PAGE and stained by Coomassie Blue. Red arrow head indicates Pho1 identified by liquid chromatography-tandem mass spectrometry after trypsin digestion (for detail, see Supplemental Fig. S8). OX1 and OX2 indicate CRCT overexpression lines, and RNAi1 and RNAi2 indicate CRCT knockdown lines.

