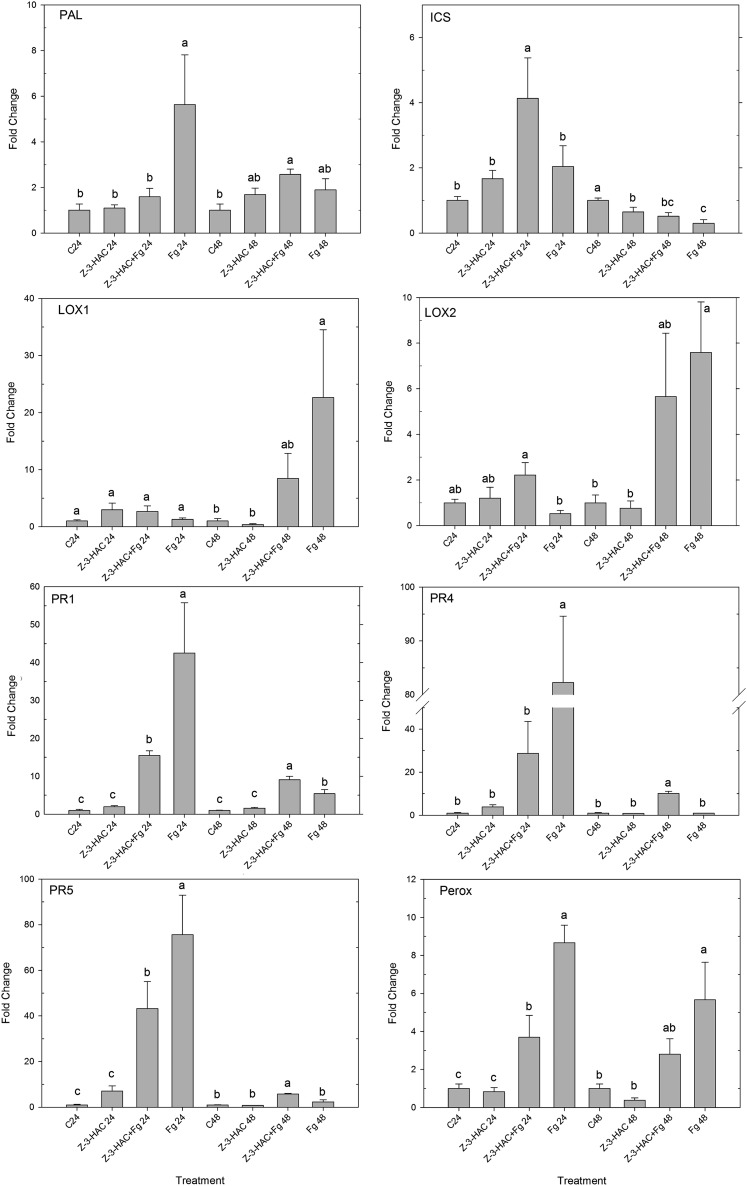
Figure 5.
Expression profiles of PAL, ICS, LOX1, LOX2, PR1, PR4, PR5, and PEROX at 24 and 48 h after challenge with a conidia suspension of F. graminearum. Data represent means of four biological replicates, each consisting of four pooled leaf sheaths. Error bars represent se. Different letters per time point indicate significant differences between the treatments (P < 0.05).

