
Figure 3.
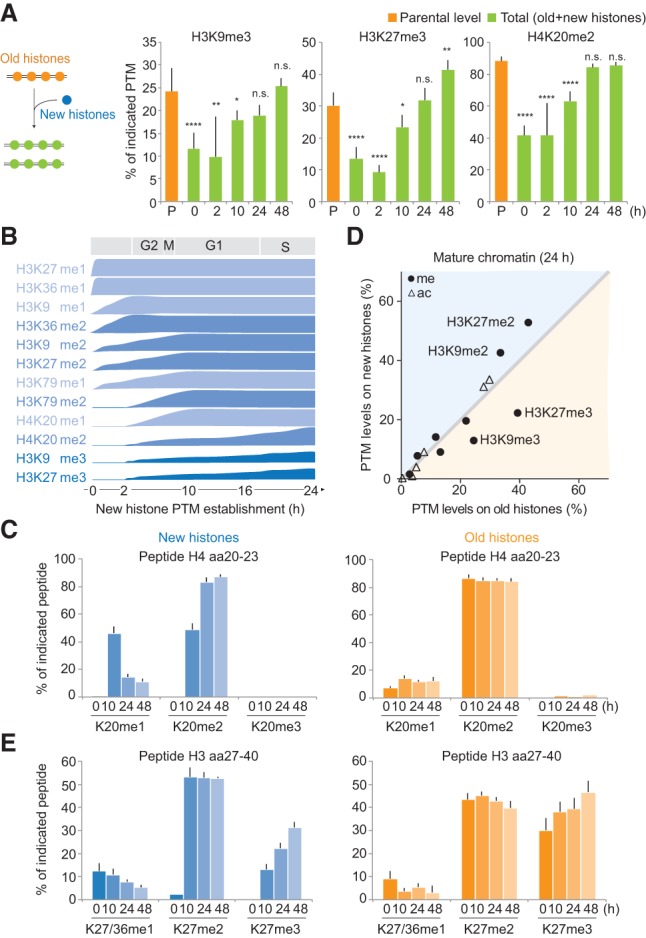
Propagation of histone PTMs across the cell cycle. Histone PTM propagation was determined by NCC coupled with double- and triple-SILAC labeling in a time-course analysis (Supplemental Figs. S4A, S5A). (A) Kinetics of PTM restoration. The total PTM level on replicated DNA (green) was compared with the PTM level of the old histones alone (P; orange), which, in nascent chromatin, represents the parental chromatin state that should to be reached by new and old histones together at the next round of replication, where they (new+old) constitute the parental histones of the daughter cells. After 24 h, the total PTM level of new+old histones (24 h; green) mirrors the parental histones of the previous round of replication (P; orange), showing that the chromatin state is propagated. Error bars indicate SD. n ≥ 3. Unpaired t-test identified differences from the parental state. A combination of double- and triple-SILAC time-course data is shown. (B) Kinetics of PTM establishment on new histones. (C) Dynamics of H4K20 methylation on new and old histones. Error bars indicate SD. n ≥ 3. (D) Overview of how histone PTMs in mature chromatin (24 h) distribute on new and old histones (n = 3). Old and new histones are identical except for the indicated marks. For values for all identified PTMs throughout the time course, C and E, and Supplemental Figure S6, A and B. (E) Dynamics of H3K27 methylation on new and old histones. Error bars indicate SD. n ≥ 3.