
Figure 4.
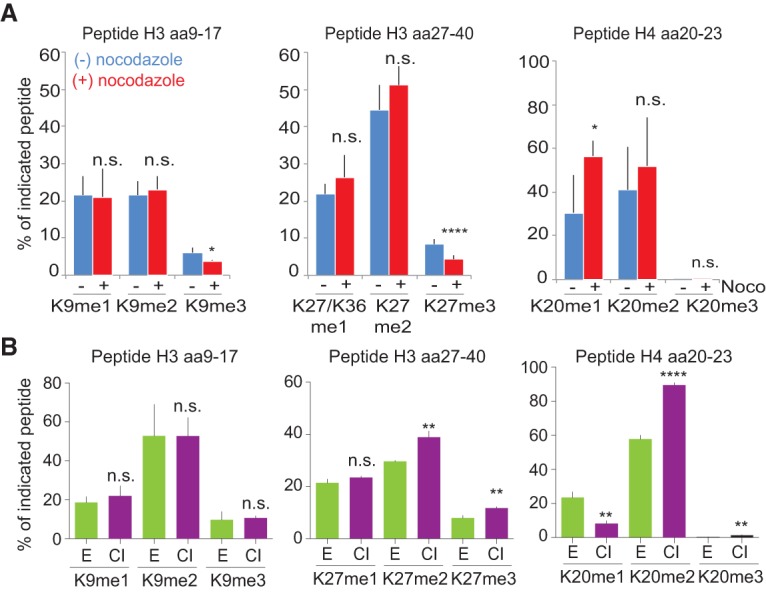
Cell cycle control of histone PTM levels. (A) After b-dUTP labeling, cells were treated with (+) or without (−) nocodazole for an additional 10, 16, or 18.5 h (Supplemental Fig. S7A). The mean of three time points is shown, with error bars indicating SD. n ≥ 3. Unpaired t-test: (****) P < 0.0001; (*) P < 0.05. (B) Analysis of histone PTM levels in exponentially growing (green) and contact-inhibited (purple) primary TIG-3 fibroblasts. Mean is shown, with error bars indicating SD. n = 3. Unpaired t-test: (****) P < 0.0001; (**) P < 0.01. For an outline of the experimental design, see Supplemental Figure S7C.