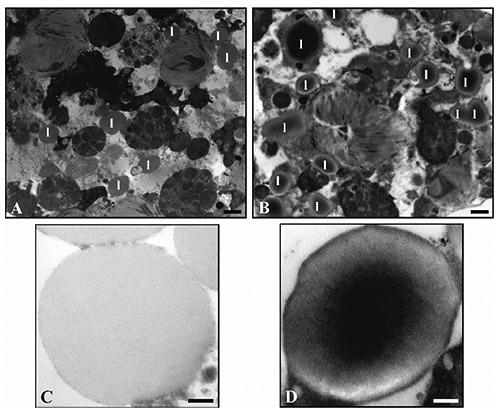
Figure 2.

The amount of lipid vacuoles (l) appears lower in the control (A) compared to the polluted samples (B). High magnification of lipid droplets in untreated specimens (C) and treated ones (D), which show an electron-dense core and a well-defined membrane. Scale bars: A, B) 1 µm; C, D) 250 nm.
