Figure 3.

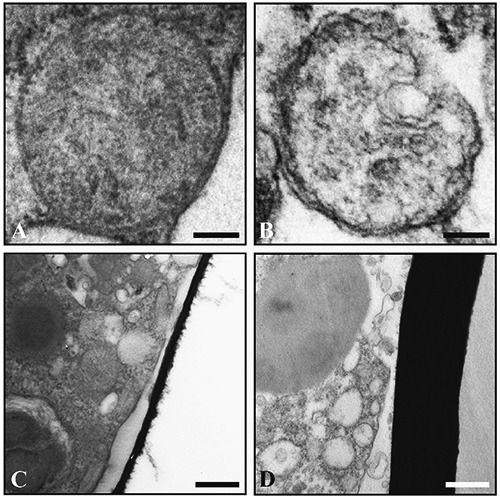
High magnification of intact (A, control) and degraded (B, treated) mitochondria. Organic lining in control (C) appears thinner if compared to the treated group (D). Scale bars: A, B) 100 nm; C, D) 500 nm.

High magnification of intact (A, control) and degraded (B, treated) mitochondria. Organic lining in control (C) appears thinner if compared to the treated group (D). Scale bars: A, B) 100 nm; C, D) 500 nm.