
Figure 1.
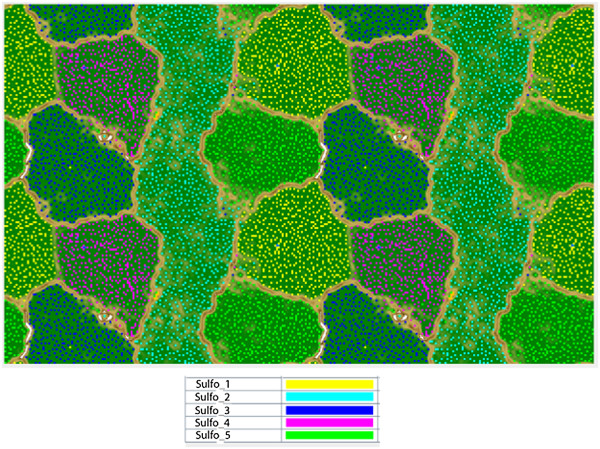
Emergent self-organizing map (ESOM) of Clostridiales sequence fragments binned by time-series abundance patterns (>1500 bp). Note that the map is continuous (top and bottom edges, left and right edges). Each point represents a sequence fragment with colors indicative of the genome bin it belongs too (see legend below).