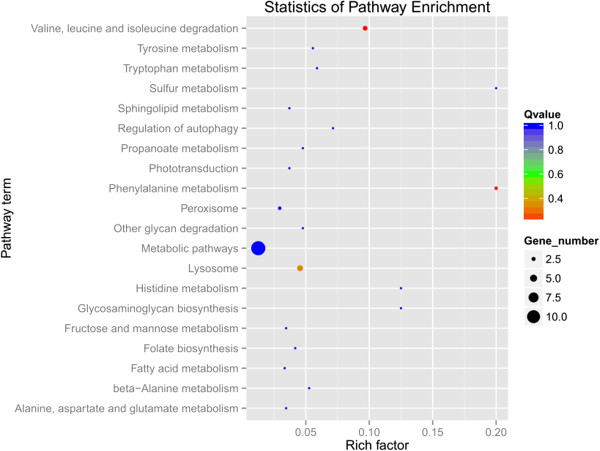
Figure 7.

The 20 most enriched KEGG pathways based on target genes of differentially expressed miRNAs in the female comparison. The x-axis shows the rich factor. The y-axis shows the pathway names. The size of each point represents the number of genes enriched in a particular pathway. The bigger the value of rich factor and the smaller the value of Q-value indicate the degree of enrichment is more significant.
