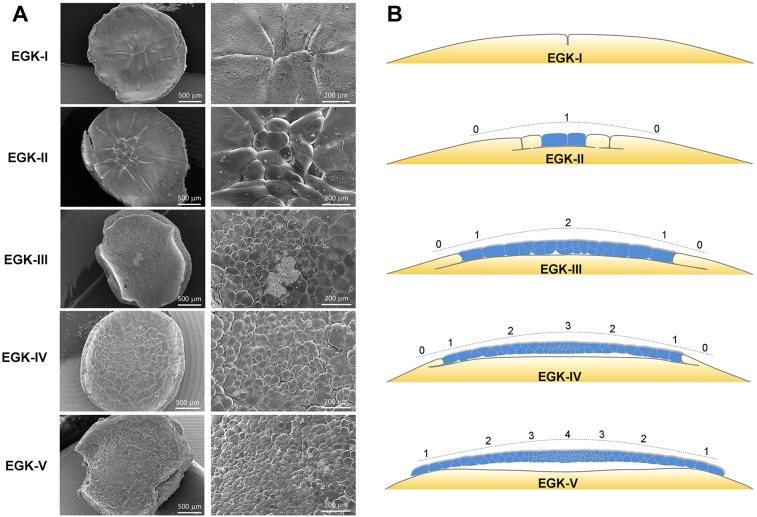
Fig. 1.
Scanning electron microscopy analysis of EGK-I to -V chick embryos. (A) Apical views of EGK-I to -V embryos under SEM. Scale bars: 500 µm (left); 200 µm (right). Details of the fracture surface are shown in supplementary material Figs S2-S6 and summarized in B. (B) Schematic view of cellularization and cell proliferation processes during chick development from EGK-I to -V. Completely cellularized blastomeres are shown in blue. Numbers above the blastoderm indicate the distribution of cell layer numbers.

