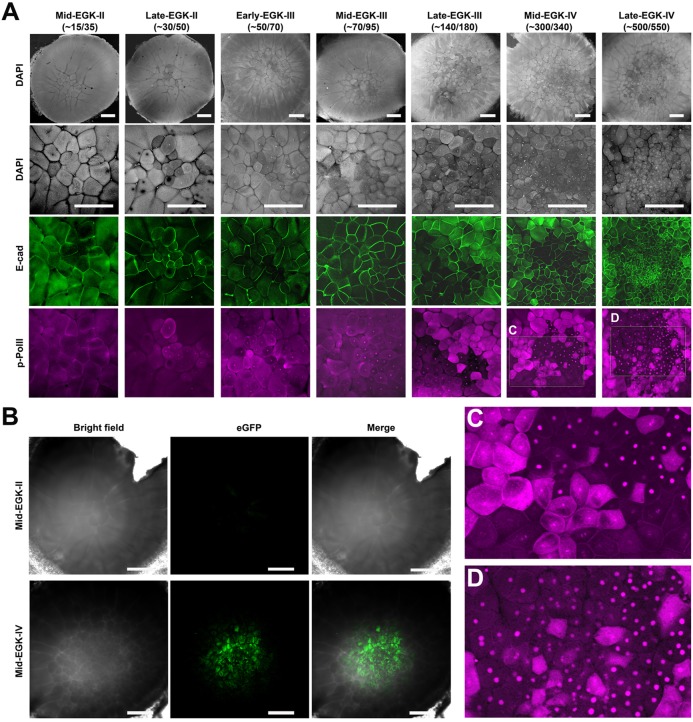
Fig. 2.
ZGA in EGK-II to -IV chick embryos analyzed by anti-Ser5 phosphorylation of Pol II CTD (p-PolII) antibody staining and by GFP transgenesis. (A) Wild-type embryos ranging from mid-EGK-II to late EGK-IV are stained for p-PolII signals. Embryos are co-stained for E-cadherin (E-cad; marking cell boundaries) and DAPI (marking nuclei). Numbers (x/y) under embryo stage labels indicate approximate counts of laterally closed cells (x) and total cells (y). (Top) Whole-embryo views after DAPI staining. At higher magnification: DAPI (second row), E-cad (third row) and p-PolII (bottom row) staining. Signals for p-PolII are negative at mid-EGK-II, very weak in late EGK-II, rapidly increase at EGK-III and become very strong at late EGK-IV. From late EGK-III to late EGK-IV, strong signals are detected both in the nucleus (in some central blastomeres) and in the cytoplasm (in adjacent blastomeres), although the proportion of cytoplasmic-positive cells decreases gradually (C,D). p-PolII-negative, small blastomeres are also observed in central areas next to similarly sized positive blastomeres (C). Signals in peripherally positioned blastomeres are much weaker or negative. (B) Embryos from GFP-transgenic male and wild-type female crosses show strong GFP signals at mid-EGK-IV but no GFP signals at mid-EGK-II. Scale bars: 500 µm.

