Fig. 1.
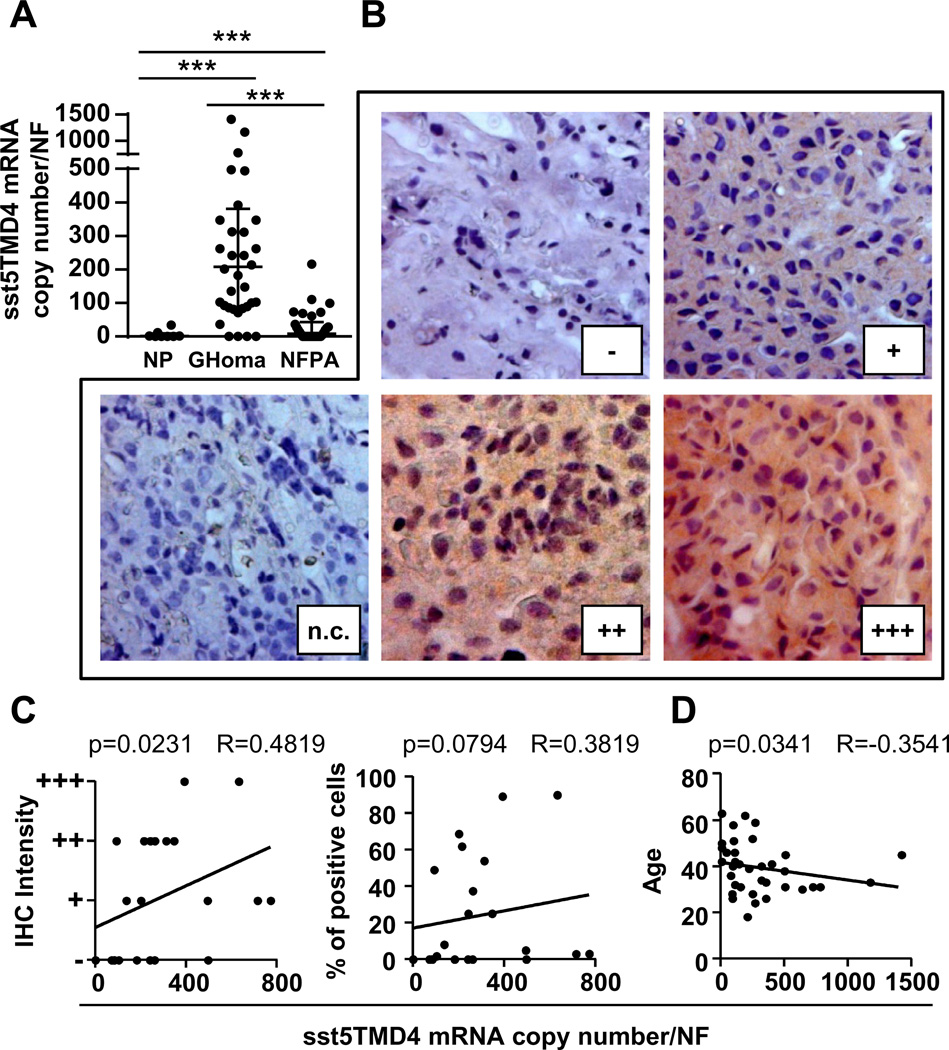
(A) Median sst5TMD4 mRNA levels in normal pituitaries (NP; n = 8), somatotropinomas (GHomas; n = 36) and non-functioning pituitary adenomas (NFPA; n = 30). (B) Representative IHC images of sst5TMD4 in somatotropinomas. (C) Positive correlation between IHC intensity and percentage of positive cells with sst5TMD4 mRNA levels. (D) Negative correlation between the age of acromegalic patients at diagnosis and sst5TMD4 levels. (A–D) mRNA copy number corrected by a normalization factor (NF) derived from the expression of three control genes (HPRT1, ACTB, and GAPDH).

