Fig. 4.
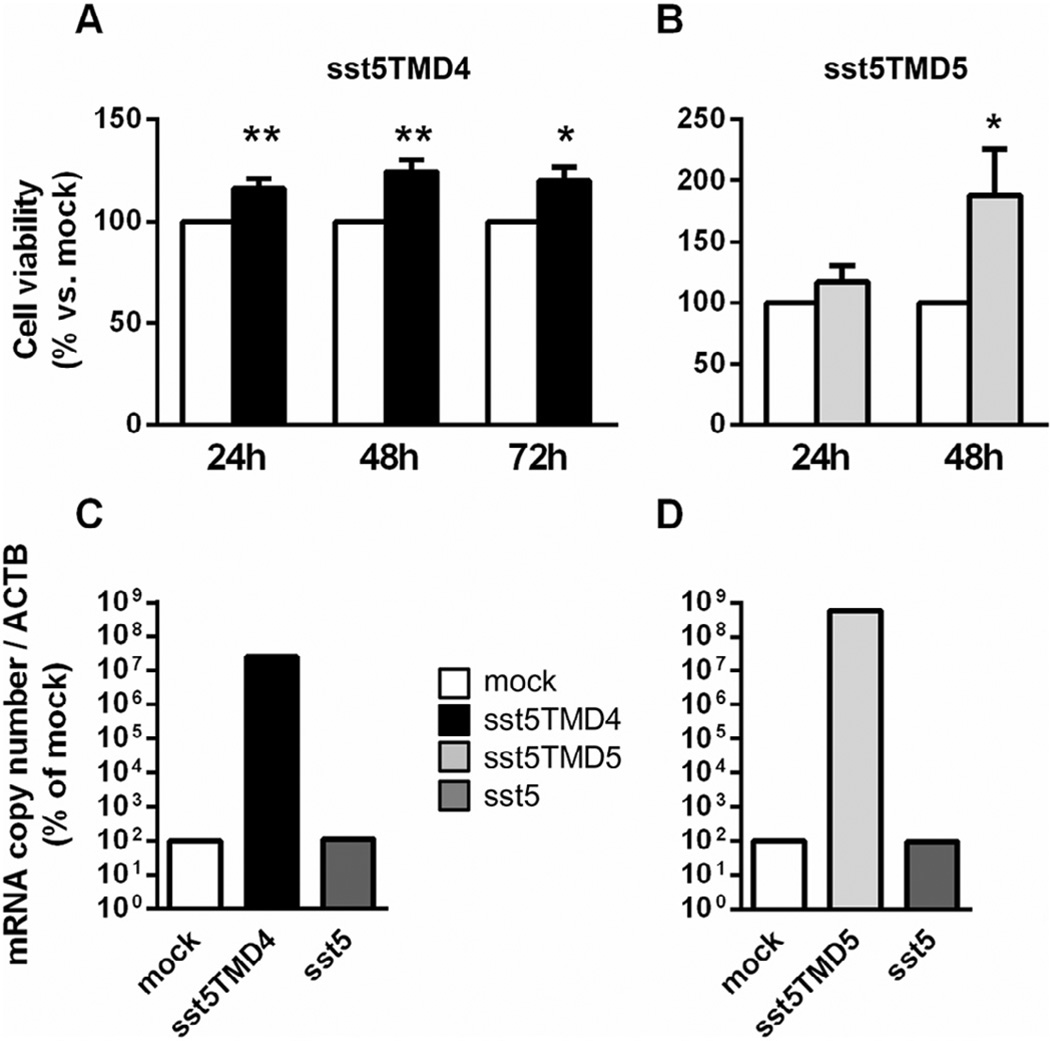
Cell viability (24-, 48- and/or 72-h) in primary culture of somatotropinoma transfected with sst5TMD4 (A, n = 5; black columns) and sst5TMD5 (B, n = 3; gray-columns) as compared with mock-transfected control cells (white-columns). Representative validation by qPCR sst5TMD4 (C, black bar) and sst5TMD5 (D, light gray bar) demonstrating an increase in sst5TMD4, but not in sst5 (C and D, dark gray bar), mRNA levels. Data are expressed as percent of mock, set at 100%.

