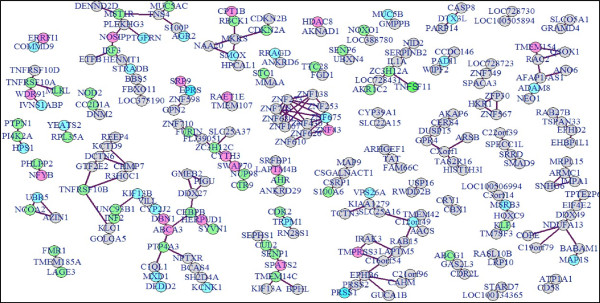
Figure 3.

Co-regulated gene clusters. Relationship between gene pairs was assessed using q-order partial correlation and gene clusters passing non-rejection rate threshold of 0.075 at q = 35 were graphed using qpgraph package in R. Green coloured gene nodes represent identified components of cell death and cell survival signal transduction pathways depicted in Figure 5, blue nodes of components of the cellular- and embryonic development network shown in Additional file 2: Figure S2 and pink nodes showing genes within the cancer-related and reproductive system network depicted in Additional file 3 Figure S3.
