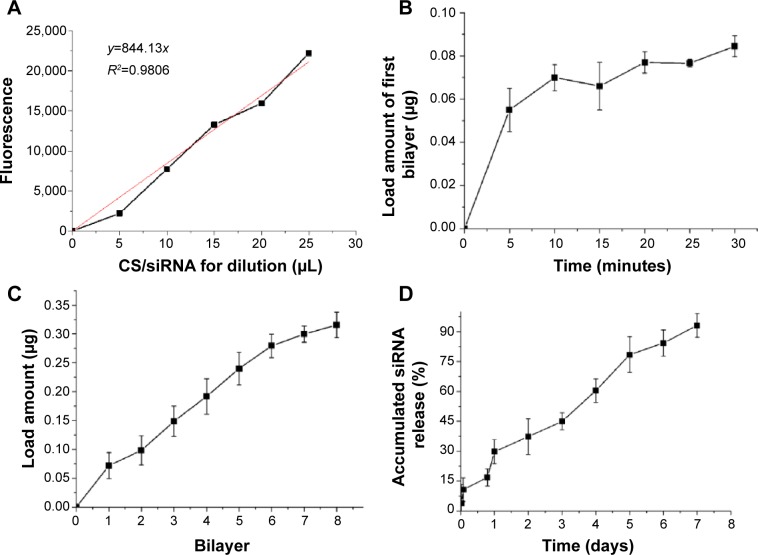
Figure 5.
Quantification of siRNA on the titanium surface.
Notes: (A) Calibration curve and linear fitting of fluorescence versus the amount of chitosan (CS)/siRNA nanoparticle solution used for dilution. (B) The amount of siRNA in the first bilayer with different incubation times. (C) Accumulated siRNA loading amount with increased number of bilayers. (D) Accumulated siRNA release profile.

