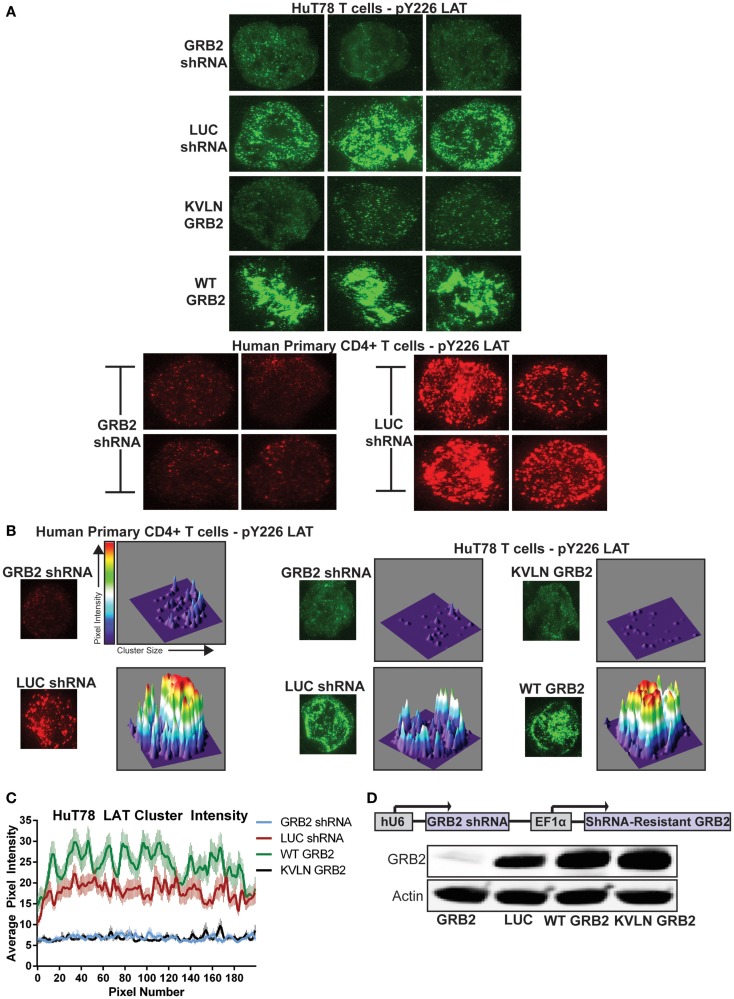
Figure 6.
GRB2 deficiency disrupts LAT microclusters. (A) HuT78 or primary human CD4+ YFP+ T cells were stimulated for 5 min on anti-CD3 coated glass coverslips. LAT microclusters were visualized by immunofluorescent TIRF microscopy utilizing pY226 LAT antibody. (B) HuT78 or primary human CD4+ YFP+ T cells were stimulated as in (A). For 3D visualization of microclusters, single cells were analyzed and graphed using ImageJ’s segmentation analysis and 3D interactive plot. (C) The average intensities of clusters across the axis of T cells containing GRB2 shRNA (n = 65), LUC shRNA (n = 60), wild-type GRB2 (n = 60), KVLN (n = 60) were quantified using ImageJ’s “Plot Profile” function. (D) Top: schematic diagram of GRB2 knockdown and shRNA-resistant protein reconstitution. Bottom: The expression of GRB2 in HuT78 T cells transduced with lentiviral constructs carrying LUC and GRB2 shRNA with or without re-expression of shRNA-resistant GRB2 proteins.

