Figure 4.

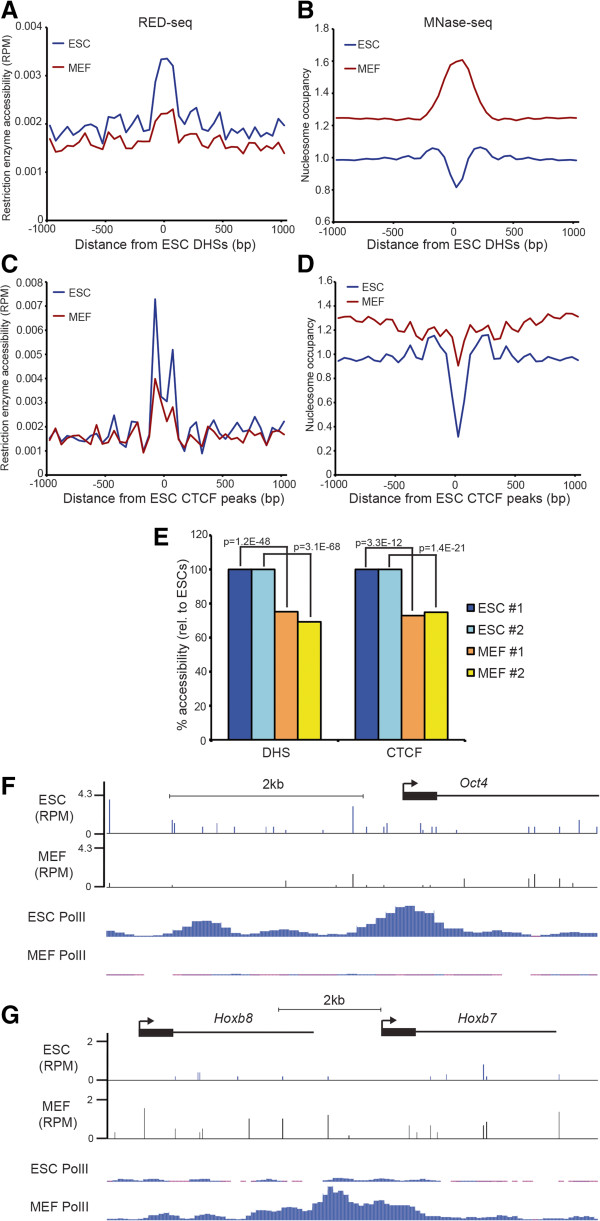
Cell type-specific differences in chromatin accessibility. (A) Average RE accessibility of ESCs (blue) or MEFs (red) shown relative to DNase I hypersensitive sites (DHSs) identified in ESCs [GEO:GSE46588]. (B) Nucleosome occupancy of the same regions is shown for ESCs [GEO:GSM1400766] and MEFs [GEO:GSM1004654]. (C) Average RE accessibility and (D) nucleosome occupancy surrounding CTCF binding regions in ESCs [GEO:GSE11431] are shown for ESCs and MEFs. (E) Average accessibilities over DHSs and CTCF binding sites were quantified for biological replicate experiments from –200 to +200 bp with respect to the indicated feature. P-values indicating statistical significance of accessibility between ESCs and MEFs are indicated. (F, G) RE accessibility of ESCs and MEFs surrounding the Oct4 gene (F) and two genes within the Hoxb cluster (G). RNA Polymerase II (RNA PolII) ChIP-seq reads [GEO:GSE29184] from ESCs and MEFs are shown for the same regions. RED-seq and MNase-seq data are plotted as in Figure 3.
