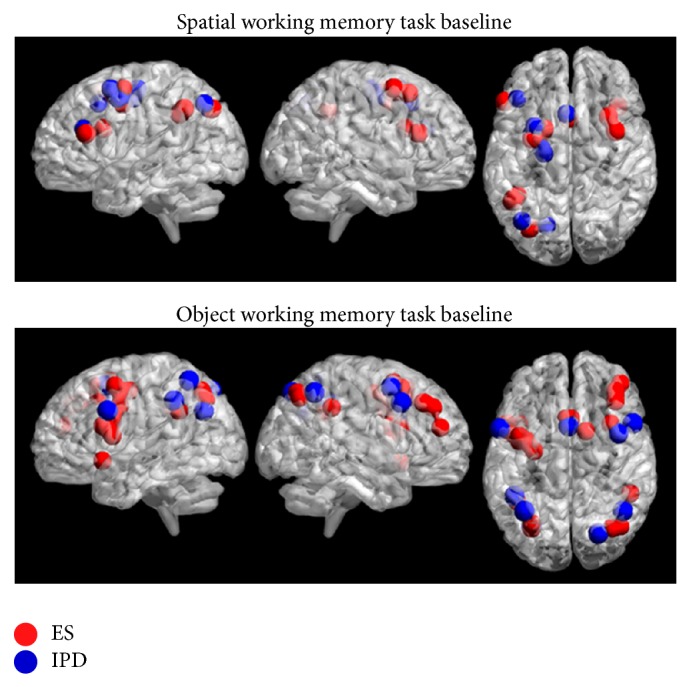
Figure 2.

Image shows SPM within-group comparisons for the SWMT-SWMB and OWMT-OWMB contrasts. 3D reconstruction of SPM contrasts (BrainNet viewer [69]). Spherical ROIs depicting peaks of activation in Cluster extent of k = 10 voxels; P value < 0.001, uncorrected in all comparisons (see text for details on the stereotactic coordinates).
