
Figure 9.
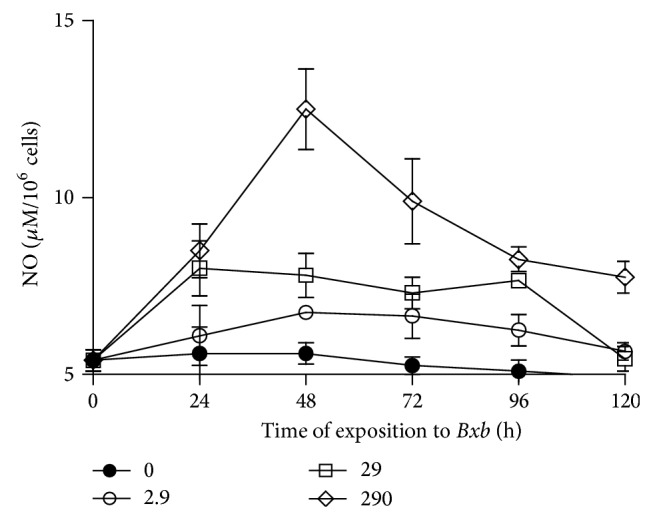
NO production. Peritoneal macrophages were obtained and exposed to 2.9, 29, and 290 μg/mL of Bxb and at different times the levels of NO were determined by Griess colorimetric reaction. Each point represents the mean value of samples from four experiments in different groups of five mice. Statistical differences between the treatments were P < 0.05.