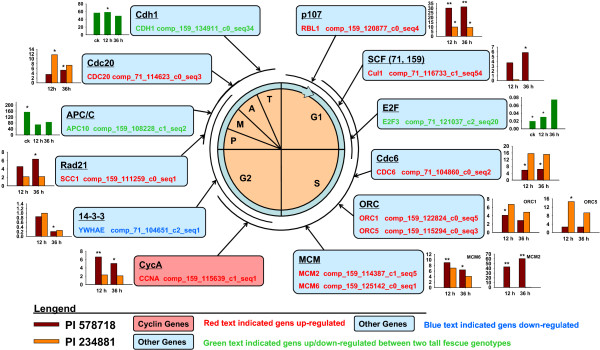
Figure 5.

RNA-Seq expression data in heat-stressed tall fescue associated with cell cycle phases. Each box represents a gene product, or group of gene products, and indicates where genes in cell cycle affected by heat stress. In the histogram, the expression data for heat-stressed tall fescue present with the fold change value. The green histogram represents the change of gene expression just between two genotypes. Stars above bars indicated significant differences relative to controls.
