Figure 7.

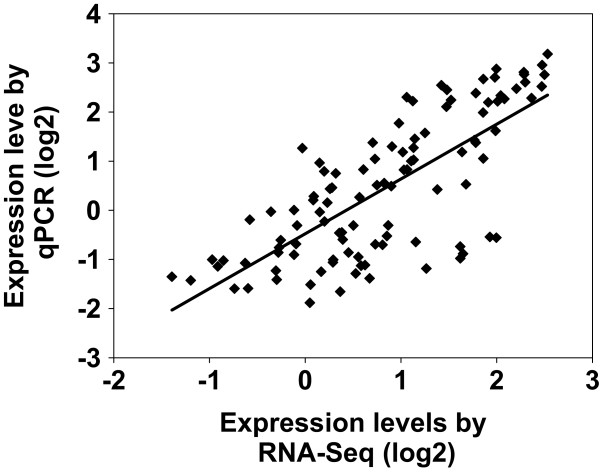
Correlations of expression level analyzed by log2 RNA-Seq platform (x axis) with data obtained using log2 real-time PCR (qPCR, y axis) for different time points.

Correlations of expression level analyzed by log2 RNA-Seq platform (x axis) with data obtained using log2 real-time PCR (qPCR, y axis) for different time points.