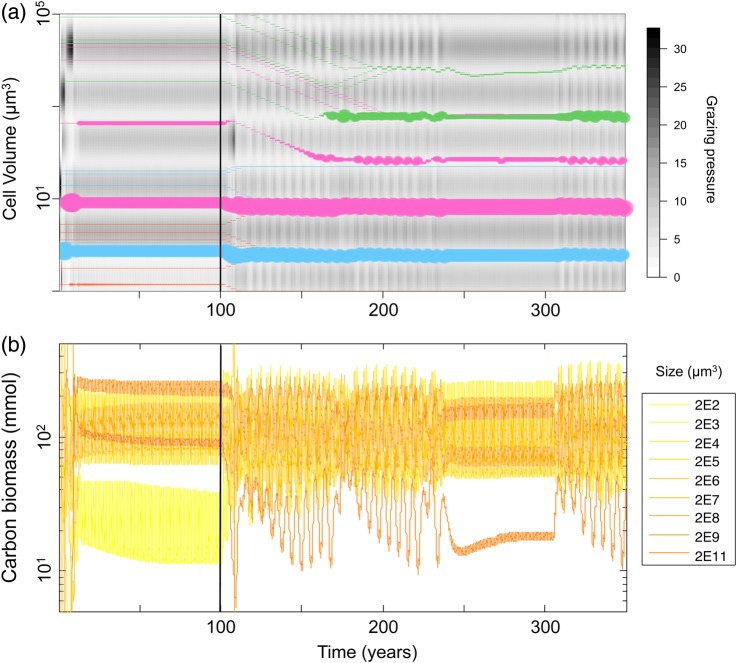
Fig. 4.
Illustrative example of model dynamics. The vertical line at t = 100 separates phase 1 (fixed traits) from phase 2 (phytoplankton trait evolution). (a) Each coloured line is a phytoplankton species; its width represents its log-abundance; the ordinate represents the trait value (cell volume). The smallest line width represents quasi-extinct species maintained by immigration. Colours represent functional groups: orange = Prochlorococcus, cyan = Synechococcus, magenta = small eukaryotes and green = diatoms. The background grey-shaded map represents the grazing pressure depending on the zooplankton dynamics and the size of the phytoplankton. (b) Population dynamics of the zooplankton species.

