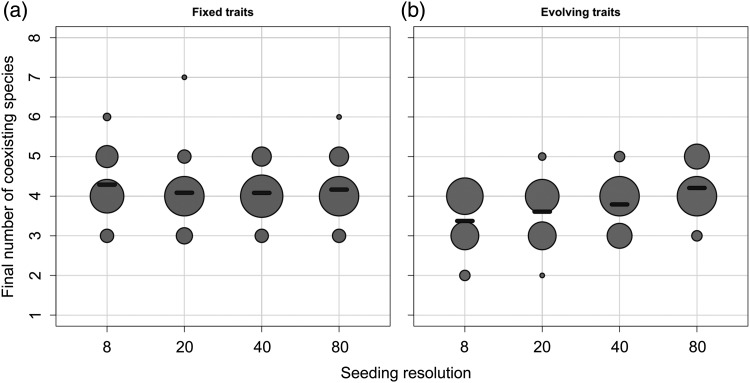
Fig. 7.
Number of viable populations (excluding quasi-extinct species, i.e. species whose abundance is below the arbitrary threshold of 1×10⁻³ mmol C of total biomass) at the end of the two phases and for each seeding condition. The size of a dot reflects the number of simulations with the considered final number of species. The black dashes represent the average of each group.

