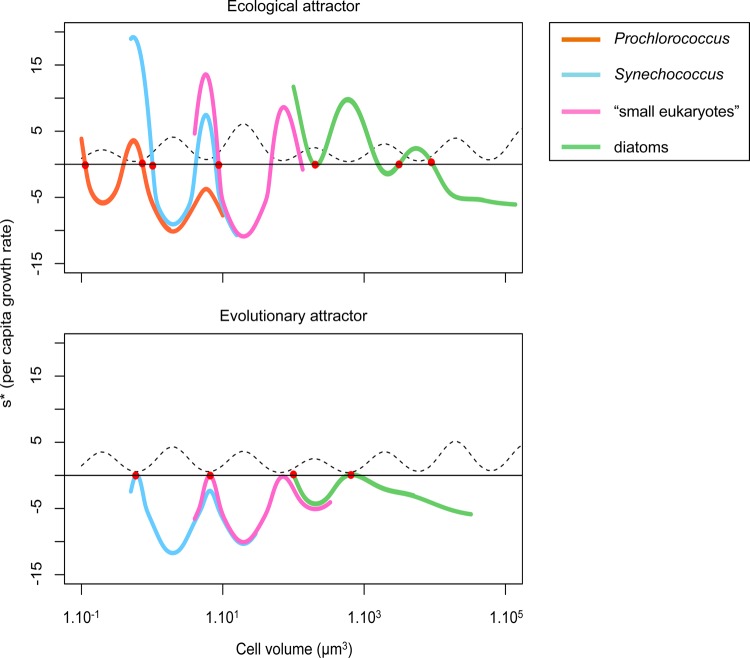
Fig. 8.
Fitness landscapes (invasion fitness as a function of cell volume) corresponding to an attractor with species whose traits are fixed on the top, and with adapting species on the bottom. Colours represent functional groups: orange = Prochlorococcus, cyan = Synechococcus, magenta = small eukaryotes and green = diatoms. The dotted line represents the grazing pressure that the phytoplankton are submitted to as a function of their size. The cell sizes of the coexisting species are represented with red dots.

