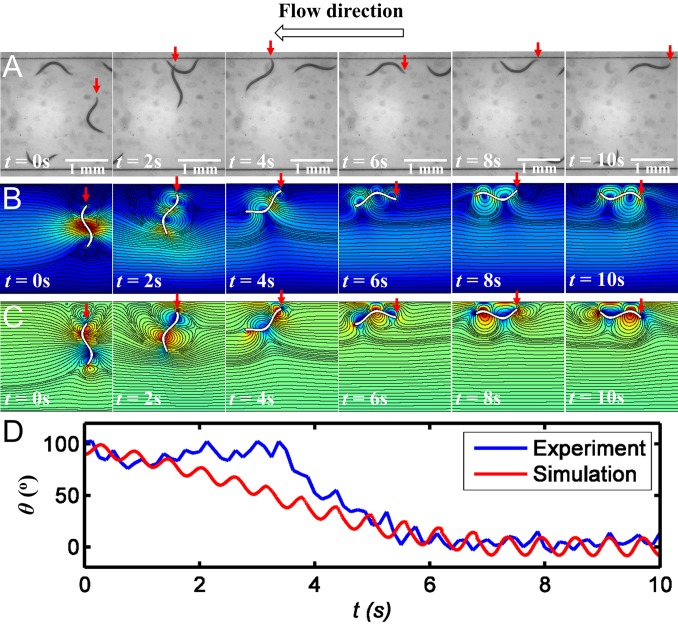
Fig. 2.
Comparison of the (A) experimentally observed and (B and C) computer-simulated change of orientation of an undulatory swimmer near a surface in the presence of fluid flow directed to the left (θ = 180°). Red arrows denote the position of the animal’s head. (D) The animal’s measured (blue) and predicted (red) orientation (θ) as a function of time. Color in B and C depicts, respectively, the velocity field and the vortex field. The solid lines in both B and C are stream lines.

