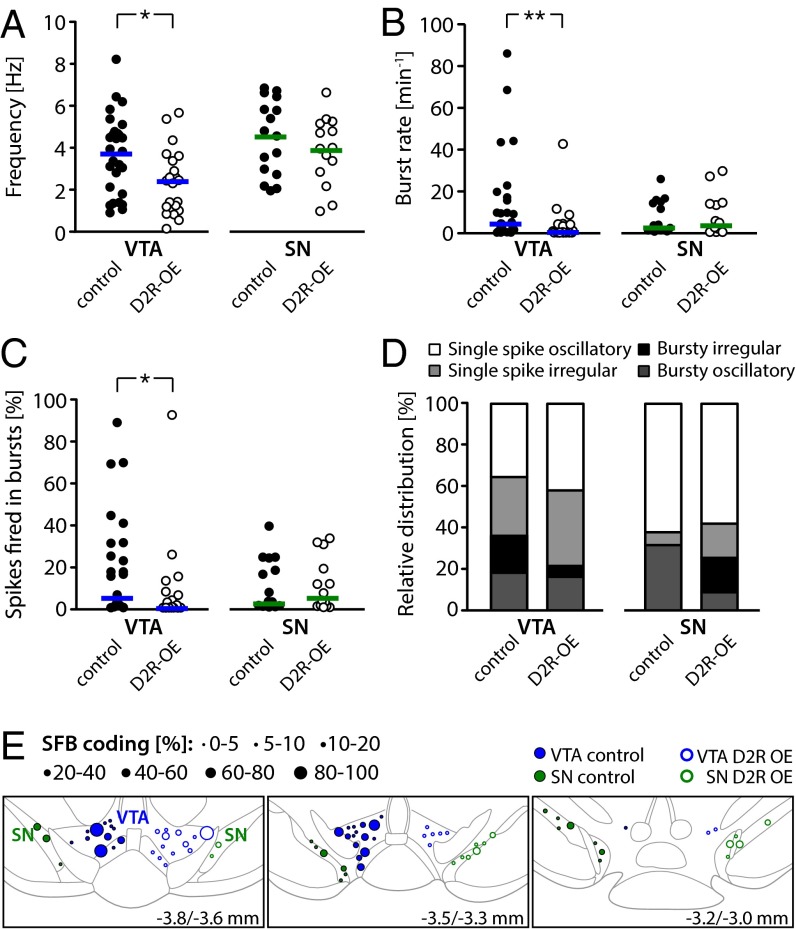
Fig. 2.
Analysis of in vivo recordings from DA VTA and DA SN neurons in D2R-OE and control mice. (A) Mean firing frequencies of identified DA VTA and DA SN neurons in control and D2R-OE mice; horizontal lines represent the mean. Note the significantly diminished rate in DA VTA neurons from D2R-OE mice compared with controls (DA VTA in control: n = 28 cells, n = 14 mice; DA VTA in D2R-OE: n = 22, n = 8; DA SN in control: n = 16, n = 8, DA SN in D2R-OE: n = 15, n = 7). (B) Mean burst set rate of DA VTA and SN neurons in control and D2R-OE mice; horizontal lines represent the median. Note the significantly diminished rate in DA VTA neurons from D2R-OE mice compared with controls (DA VTA in control: n = 28 cells, n = 14 mice; DA VTA in D2R-OE: n = 22, n = 8; DA SN in control: n = 16, n = 8, DA SN in D2R-OE: n = 15, n = 7). (C) Accordingly, the % SFB was selectively reduced in DA VTA neurons from mice with striatal D2R overexpression. Horizontal lines represent the median (DA VTA in control: n = 28 cells, n = 14 mice; DA VTA in D2R-OE: n = 22, n = 8; DA SN in control: n = 16, n = 8, DA SN in D2R-OE: n = 15, n = 7). (D) Relative distribution of firing patterns in DA VTA and SN neurons defined by GLO-dependent ACH classification (DA VTA in control: n = 28, DA VTA in D2R-OE: n = 19, DA SN in control: n = 16, DA SN in D2R-OE: n = 12). (E) Functional burst map. DA neurons recorded from control (left side, ●) and D2R-OE (right side, ○) mice are plotted corresponding to their position in the VTA (blue) and SN (green). The symbol size refers to the % SFB. Coronal planes are relative to bregma and are modified from Paxinos and Franklin (56) (also Tables S1–S3). *P < 0.05; **P < 0.005.

