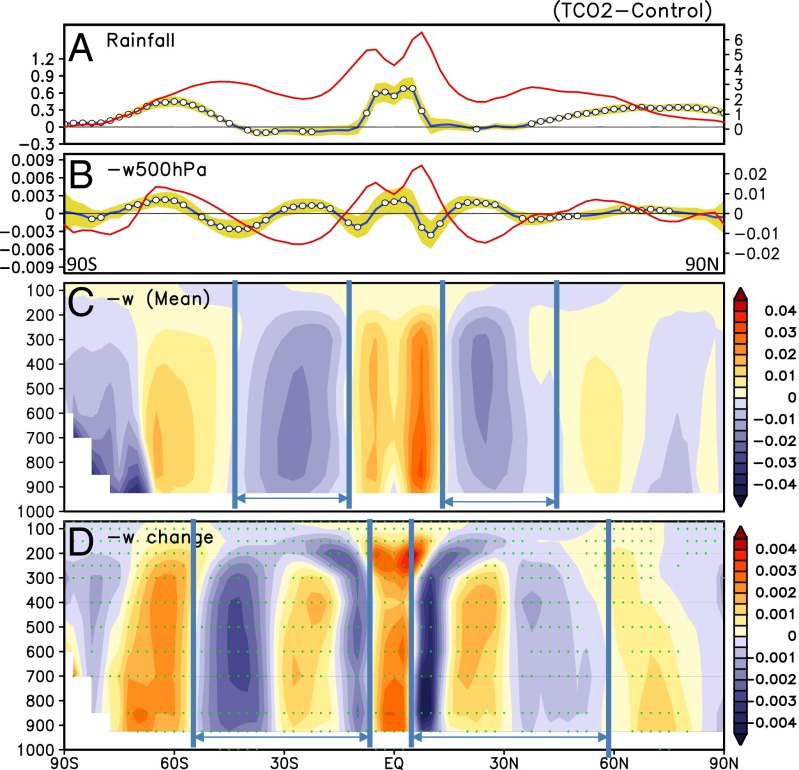
Fig. 1.
Latitudinal profile of MMM (A) rainfall and (B) 500-hPa vertical motion. Climatology is indicated by red line, and anomaly is indicated by black line. Open circles indicate where more than 75% (25/33) of models agree in the sign of the anomalies. Latitude−height profile of MMM 500-hPa vertical motion for (C) climatology and (D) anomaly. The width of the subsidence zones are indicated by the vertical blue lines. Grid points where more than 25 models agree in the sign of the anomaly are indicated by green dots. Rainfall is in units of millimeters per day, and vertical motion is in units of negative pascal per second. Different unit scales are used for climatology and anomalies.

