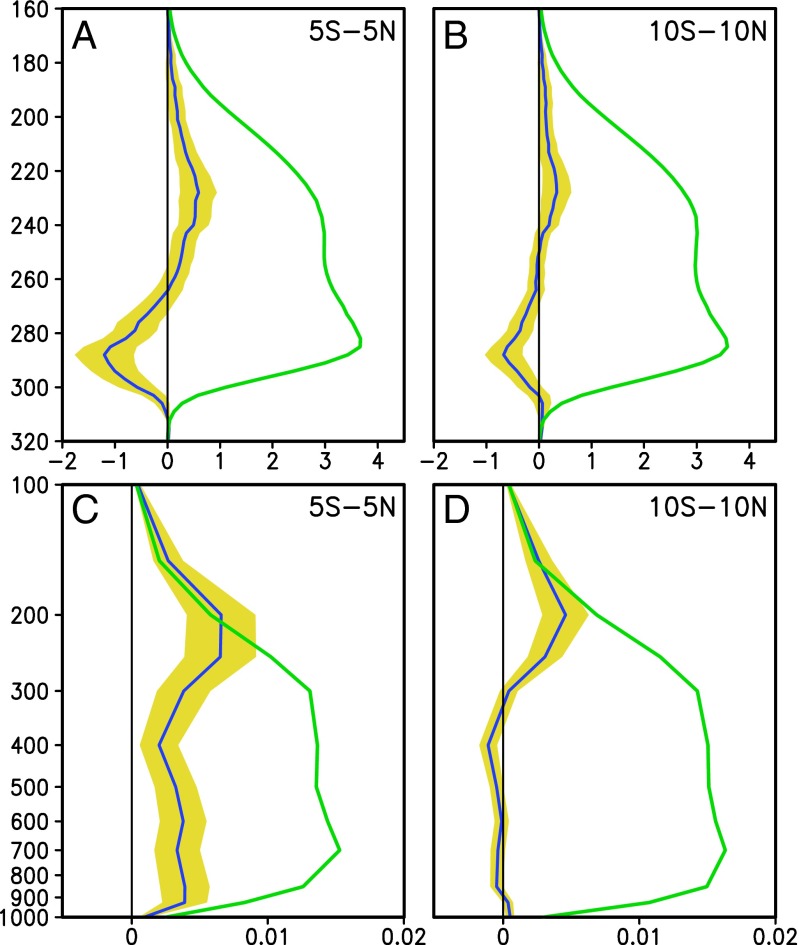
Fig. 2.
MMM outgoing longwave radiation (OLR) probability distribution function as a function of OLR flux (in watts per square meter on y axis) averaged over (A) 5°S−5°N, and (B) 10°S−10°N. Vertical profile of mean vertical motion averaged over (C) 5°S−5°N, and (D) 10°S−10°N. Climatology is indicated by green line, and anomaly is indicated by blue line. The model spread is shown as yellow shading. The magnitudes of the anomalies have been doubled to enhance clarity. Vertical motion is in units of negative pascals per second. OLR pdf is nondimensional.

