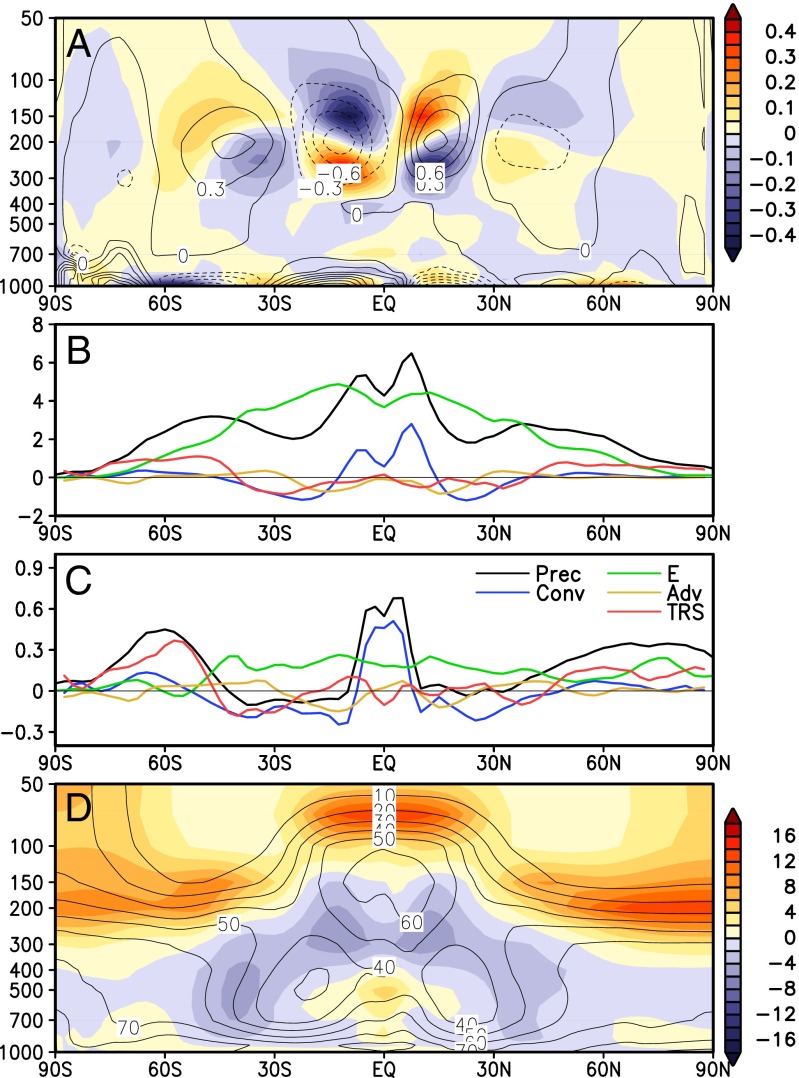
Fig. 3.
Latitude−height cross section of (A) anomalous meridional zonal mean winds (meter per second) and (D) anomalous humidity (percent). The climatological mean is shown in contour, and anomaly is shown in color. Latitudinal profiles of components of moisture budget for (B) the control and (C) the anomaly. See Eq. 1 for explanation of symbols. Units in millimeters per day.

