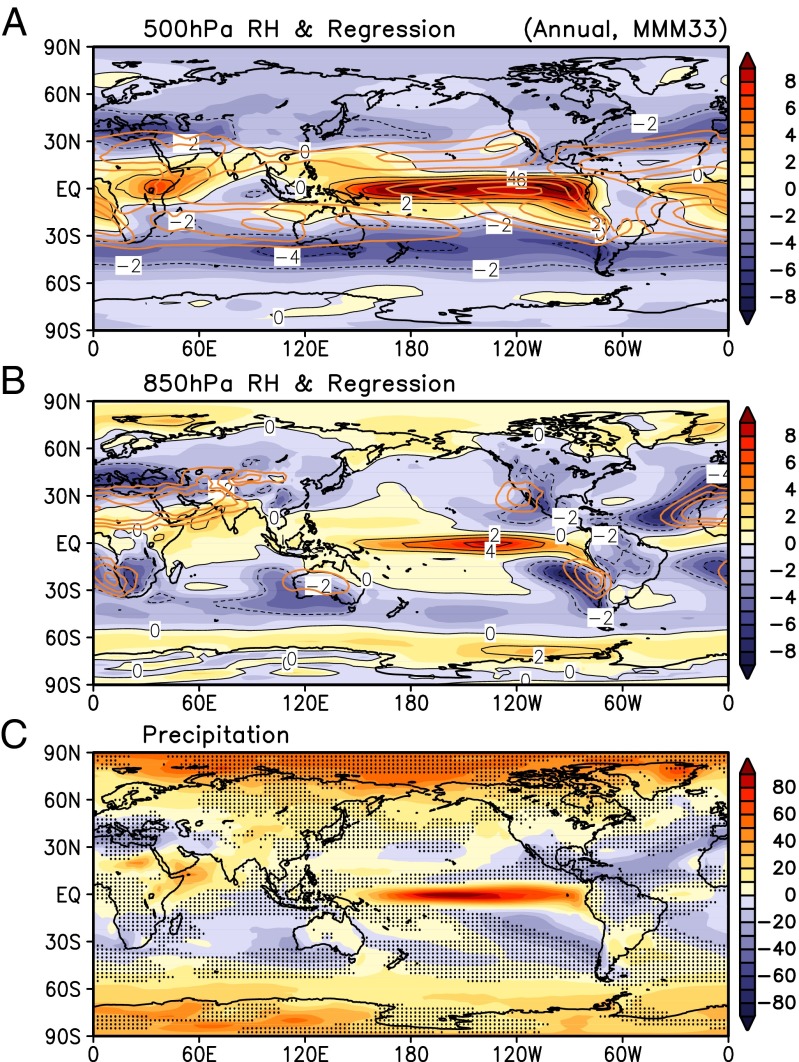
Fig. 4.
Spatial pattern of regression of meridional mass flux in the upper troposphere (200−150 hPa) at 10°S−10°N with 500-hPa RH anomaly (A) and 850-RH anomaly (B). Climatological dry zones (RH < 40 for 500 hPa, and RH < 50 for 850 hPa) are indicated by orange contours. Also shown are anomaly rainfall pattern (C), with regions of anomalous downward motion stippled. Unit of unit of regression is in percentage change per kilogram per meter. Unit of rainfall is in percentage.

