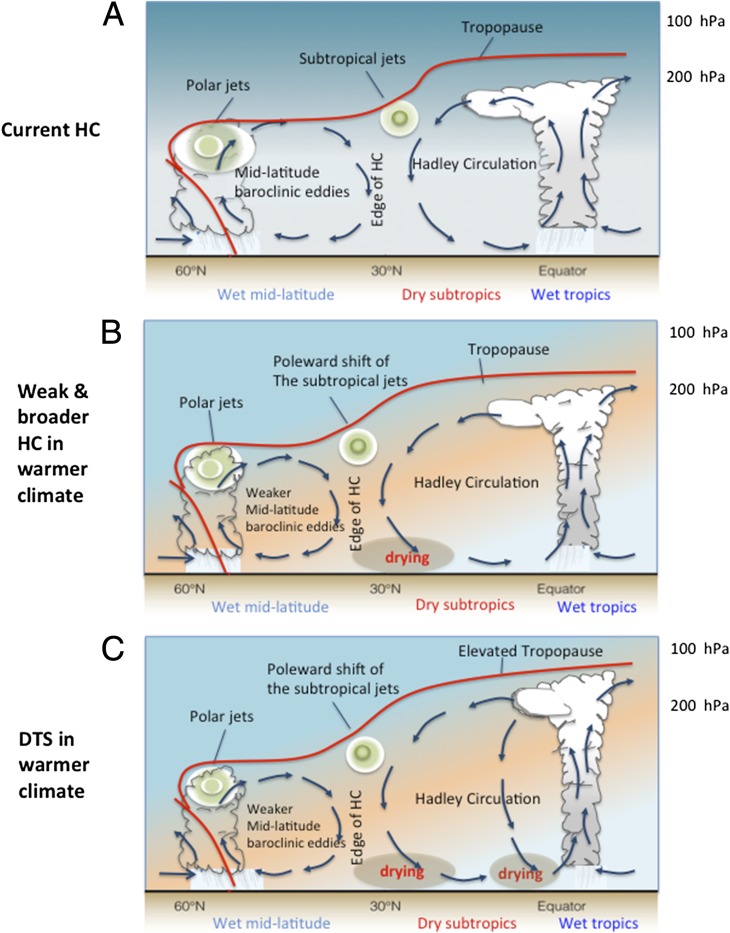
Fig. 1.
Illustration of the HC and its relationship to the midlatitude baroclinic eddies: (A) climatology in current climate; (B) the weaker and broader HC projected by many CMIP3 and CMIP5 models; and (C) the stronger and broader HC due to DTS in Lau and Kim. The light orange color illustrates the warming due to greenhouse effect that increases the static stability of the atmosphere and weakens the equator-to-pole surface temperature gradient.

