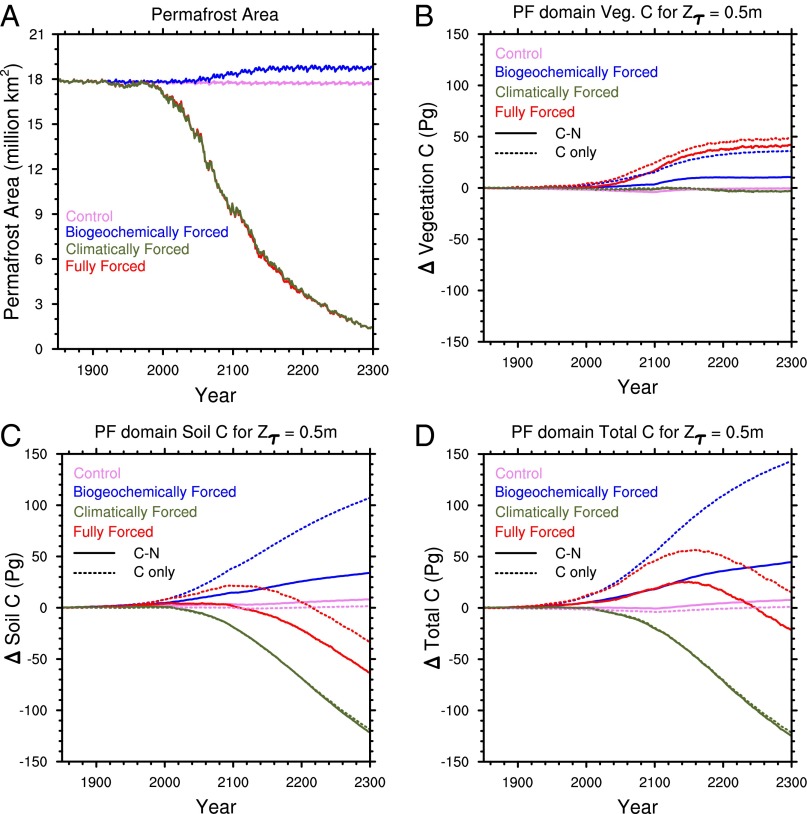
Fig. 1.
CLM near-surface permafrost area and C stock responses to forcings (combinations of changing vs. fixed CO2 and climate), and model configurations (C only and combined C−N) for the case with relatively insensitive deep C (Zτ = 0.5 m). (A) Near-surface permafrost area, defined as area with permafrost simulated in upper 3 m of soil. (B) Change in vegetation C over the permafrost region. Increase in vegetation C at 2100 is due to a discontinuation of wood harvest after the end of the RCP8.5 land use dataset and occurs in all cases. (C) Change in total C of the permafrost region, defined as the geographic area with permafrost in upper 3 m for 1850–1900 period. (D) Change in soil and litter C over permafrost domain. The solid and dashed lines represent the coupled carbon and nitrogen simulation and the carbon-only simulation, respectively.

