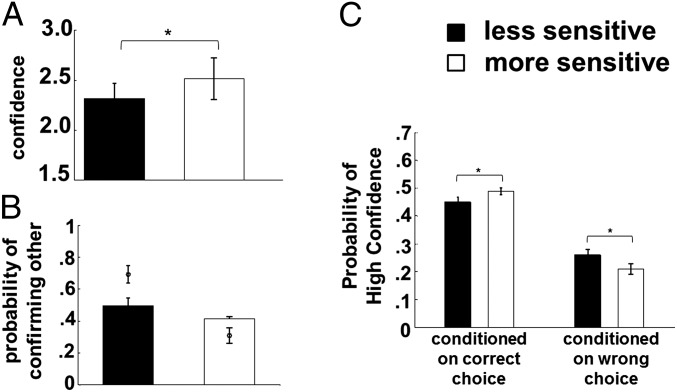
Fig. 2.
(A) Average confidence. Black bars, less sensitive dyad member; white bars, more sensitive dyad member. (B) Probability of confirming partner’s decision. Circles indicate the recommendation of the optimal model. (C) Probability of high confidence given a correct (left bars) and a wrong (right bars) decision. *P < 0.05. All error bars are 1 SEM.

