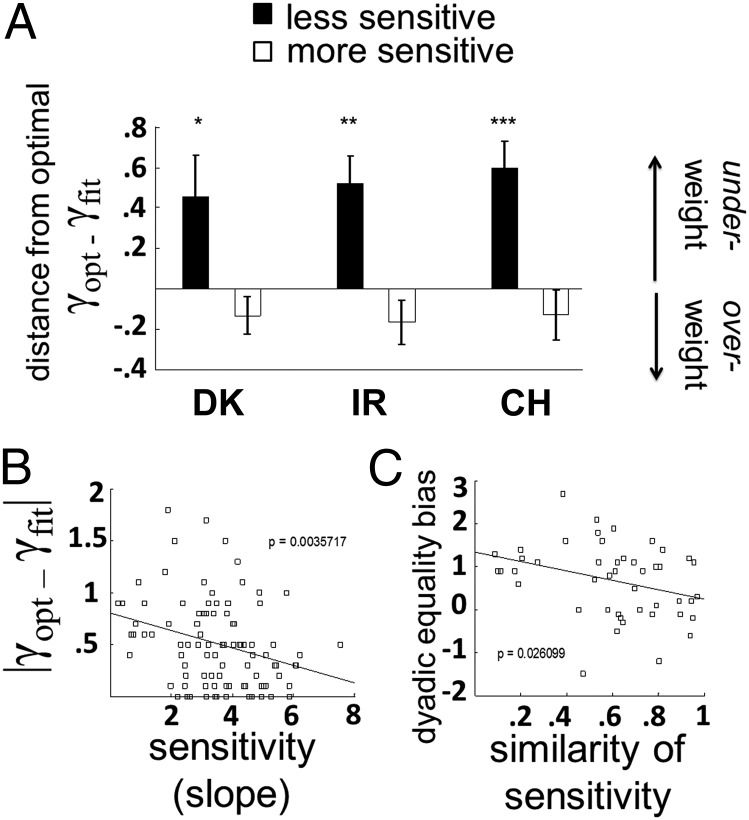
Fig. 3.
(A) Deviation from optimal performance. Data plotted separately for each country. Positive and negative values indicate over- and underweighting, respectively. Black bars, less sensitive dyad member; white bars, more sensitive dyad member. *P < 0.05; **P < 0.003; ***P < 0.001. Error bars are 1 SEM. (B) Absolute deviation from optimal weighting, plotted against sensitivity (slope of psychometric function). Each data point represents one participant. (C) Combined equality bias is plotted against similarity of sensitivity. Each data point represents a dyad. For B and C, data are collapsed across cultures, and the lines show the least-square linear regression.

